The Exploit Prediction Scoring System (EPSS) is an open, data-driven effort for estimating the likelihood (probability) that software vulnerabilities will be exploited in the wild. We achieve that by collecting ground-truth information about which and how often vulnerabilities are being exploited in the wild and comparing that with attributes of each vulnerability.
I’ve been involved with EPSS since its inception several years ago and we just had a big day in the world of EPSS: on February 4th, 2022 we released an updated model. This update carried with it several changes and improvements to both the model and the backend that I wanted to run through here.
We had outlined the goals and objectives in the first EPSS model based on the data we had and how we thought EPSS may be used. was to. Why we chose that is a little complicated and worthy of it’s own blog post, but we set four objectives for that first model:
EPSS v1 goal:
Estimate the probability of observing exploitation in the first year after a CVE was published
EPSS v1 objectives:
- Simple to Implement (we envisioned anyone implementing in excel)
- Interpretable (variables had weights we could compare)
- Parsimonious (only use variables that really mattered and were easy-ish to collect)
- Performant (outperform existing vuln scores)
We met those objectives by building a simple linear model and extracted the 16 most important variables. The model could be communicated in a presentation slide and implemented in excel. All of the variables had a single weight that had meaning, higher weight meant it increased the probability of exploitation and vice versa. One of the main differences from other scoring systems (not in our goals/objectives) is that we could actually measure and communicate performance. Since we had some ground truth data about exploitation activity, we could create point-time-estimates, fast-forward through the data and actually measure our estimations and communicate our expectation of how good EPSS would perform. Our original paper was transparent and open about the false positive rate and overall performance relative to other vulnerability prioritization strategies. TLDR: it wasn’t perfect by any stretch, but it was better than the de facto standard.
Many things have changed since that first model. We realized that most consumers do not want to score their own vulnerabilities. They would rather have their vendor or some centralized authority do that. We also realized that while an interpretable model was interesting and would both answer some questions and maybe even raise new questions, it wasn’t all that critical to prioritizing which vulnerabilities were the most important day to day.
These two things, along with improved data collection, opened up some possibilities for our next model and we shifted both the goal and reduced our objectives:
EPSS v2 goal:
Estimate the probability of observing exploitation in the next 30 days
EPSS v2 objectives:
- Centralized (data collection, scoring, and API driven)
- Performant (outperform other scores and EPSS v1)
The shift towards a centralized infrastructure means we no longer had to be critical of which data we included and the number of variables used in EPSS went from 16 to over 1,100. As long as we could automatically collect data for vulnerabilities, it was fair game to be included in the model. We also downgraded the need for interpretability to a “nice to have” (which we ended up getting to some extent), which opened up more complex models. The result of these changes is daily scores being generated from a gradient boosted tree-based model instead of the simple linear model in the first version and the EPSS scores are seeing a big improvement in their overall accuracy.
The Shift in the EPSS Goal
Maybe you noticed, the shift in what the EPSS probability represents has shifted in the latest model and it is a very big deal. If we look across our systems, we will undoubtedly find CVEs that were published more than a year ago. Estimating the probability of exploitation in the first year won’t be all that helpful and it required that we have visibility into what happened in the first year before we could include it in the model. Because of that, EPSS v1 was limited to 2017 and later when we started to get exploitation activity recorded.
With the shift in our goal we are now scoring every published CVE. Instead of limiting our window to exploitation in the first year after publishing, we changed our perspective to train our model on what’s going on in the data right now. Maybe vulnerabilities published in 2012 are being actively exploited 10 years later (spoiler: they are) and we want the model to capture that. We still have some challenges and limitations in this approach (i.e. around data sources we can use) but we are headed in a better direction.
The Performance of EPSS
The performance of the latest EPSS model is covered in more detail on FIRST.org in the EPSS model discussion. But I wanted to touch on this graphic shared on FIRST.org. It shows the different thresholds for CVSS version 3.1 (left), the first EPSS (middle) and then the updated EPSS model (right). Note how the coverage (the percent of exploited vulnerabilities in the following 30 days that would have been remediated) is held relatively constant across the three strategies. 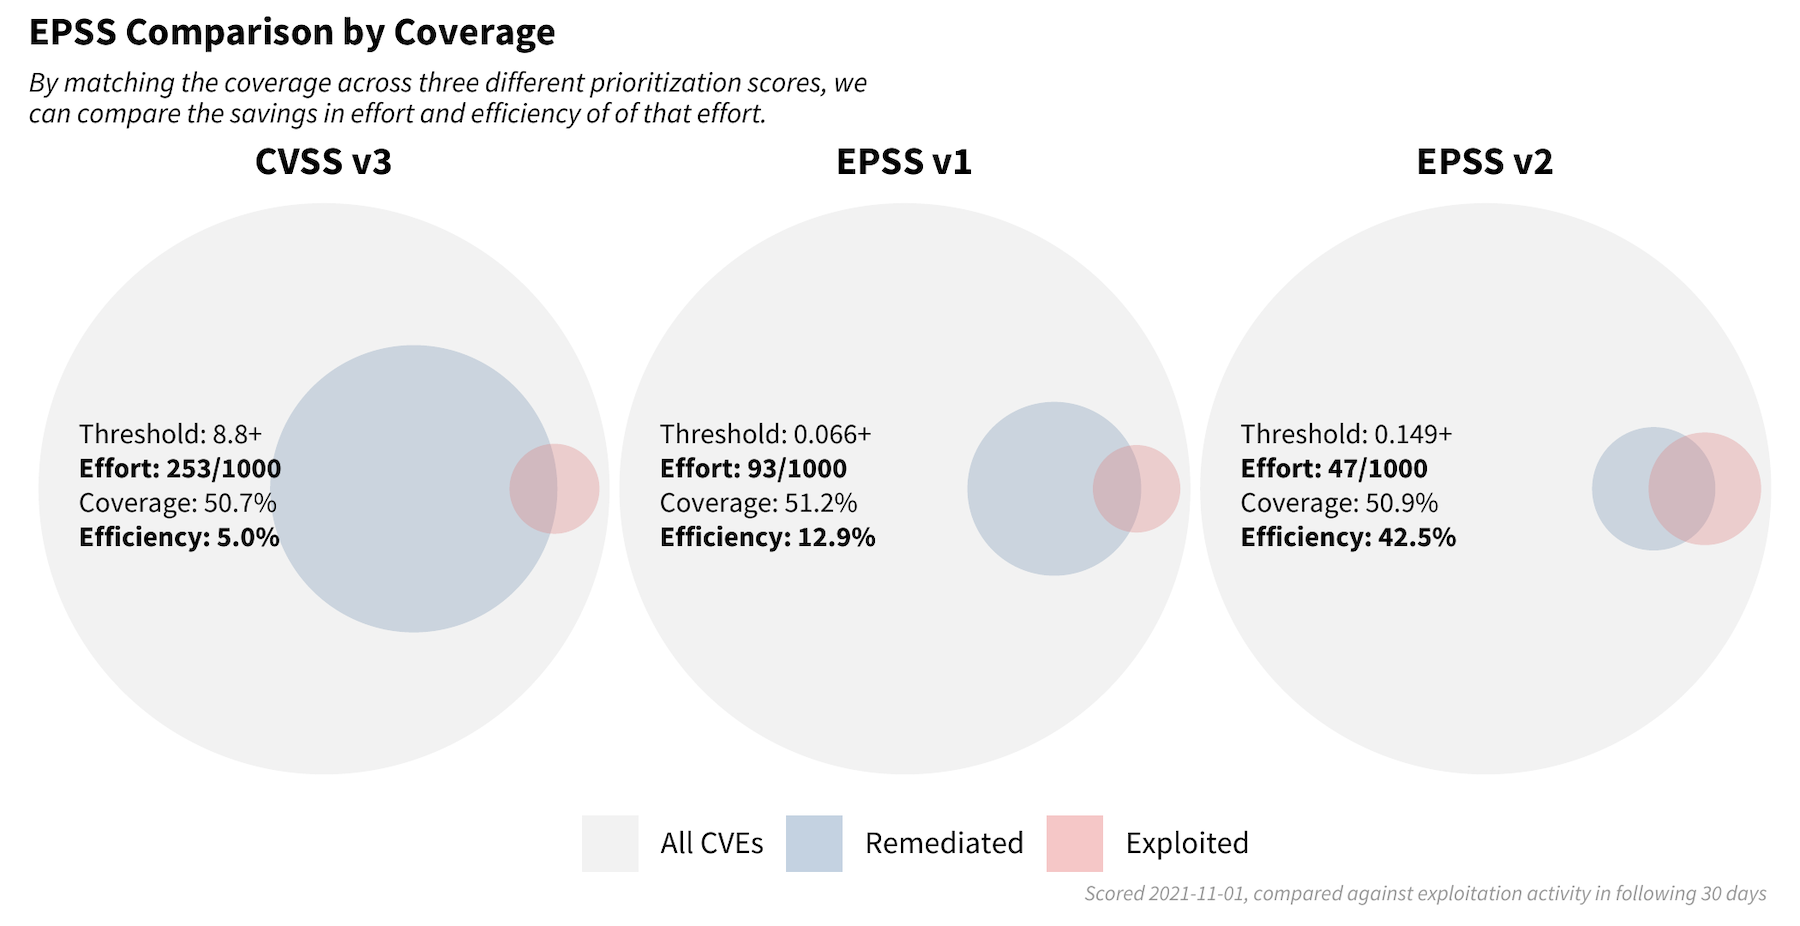
If an organization sets a threshold at CVSS 8.8 and above (left circle), they will have to remediate 253 out of every 1,000 published CVEs (with CVSS 3+ scores) to achieve about a 51% coverage. That gives a CVSS strategy an efficiency of about 5% (the percent of remediated vulnerabilities that were exploited in the following 30 days). The first EPSS model is still performing well even two years after it was first trained, only requiring 93 out of every 1,000 CVEs (with EPSS scores) to be remediated and achieving an efficiency of 12.9%. But with the new EPSS model, we reduce the number of vulnerabilities to remediate in half to 47 out of every 1,000 CVEs and achieve an efficiency of 42.5%.
This work suggests a shift in how we should think about vulnerabilities. Instead of being hyper-focused on identifying all of the vulnerabilities we need to remediate, we also need to balance it against the reality of the time, money and energy needed to remediate. So maybe one of the strengths of EPSS isn’t just that we are just finding critical vulnerabilities to fix, but more in that we are also better identifying the vulnerabilities that can be addressed at a slower pace. Lowering the false positives like this increases the efficiency of our security spending and that’s a good thing.
One last note: the EPSS SIG is open, if you have any passion around vulnerabilities and/or would like to contribute back to the community, we’d love to have you. Plus, now that EPSS v2 is out, we are already working on the next iteration and hope to create a “release early, release often” approach to the EPSS model and have continual improvements!
EPSS scores are generated every day and estimate the probability each vulnerability will be exploited in the wild in the next 30 days. All of the scores are free and open to download at https://www.first.org/epss/data_stats.