This blog series is sponsored by Secure Systems Innovation Corporation (SSIC), a cyber risk advisory services firm that empowers business decision making. To learn more about SSIC and its support for this research, please visit their website and/or related blog post on this topic. Posts in this series: Part 1: Ransomware payment Rate; Part 2: Ransom Demands; Part 3: Ransomware Prevalence
Usually, a blog series like this would begin with a description of the threat in focus, a timeline of events, some grave-sounding statistics, and perhaps a fear-inducing quote from a security expert. But let’s face it – everyone in your extended family dinner discussions has heard about ransomware at this point. We can skip all that.
Even though ransomware awareness runs everywhere, consensus around its prevalence, payment rates and amounts, and overall consequences does not. We’ve noticed some sharply divergent statistics bandied about over the last couple years, leaving us wondering what’s true truth vs fake news. Noticing the same issue, SSIC approached us about setting the record straight on ransomware risk factors, and we eagerly jumped at the opportunity.
What follows in this series is a meta-analysis of ransomware risk factors based on public research reports, blogs, and articles on the subject. I’m kicking things off by examining the payment rate, or percentage of ransom demands that are paid by victims. It is admittedly an odd place to start; beginning with the frequency or prevalence of ransomware seems more logical to me. But sometimes you have to follow a muse, and Tony Martin-Vegue set the stage with his blog post titled “The Birth of a Ransomware Urban Myth. In it, he investigates a study that claims 38% of ransomware victims pay the attackers and determines that it’s pretty much bunk (along with a lot of other “research” that is filled with agendas, yet devoid of sound methods).
While Tony makes a convincing case that the particular research in question is less-than-reliable, the question remains about whether the 38% statistic holds any water on its own. How far off the mark is that? Is it high or low? A lot or a little? How would we even know? What do other sources say about it? Which ones can we believe?
Of course, these questions aren’t limited to ransomware payments – they’re near universal in the cybersecurity field. We have an ever-growing set of research available (see the Cyentia Library for examples), but gleaning reliable information from them to drive decisions and practice is increasingly challenging. Especially when so many conflicting findings and conclusions abound. Improving this state of affairs is one of the primary reasons we started the Cyentia Institute and why we’re excited to kick off this series. Let’s do that without further adieu.
Data Sources on Payment Rates
To identify sources of statistics for this meta-analysis, we leveraged the recently-released Cyentia Institute Research Library. We also tracked down references to sources not included in the Library and topped it off by searching for additional material on the web. Table 1 provides a list of these sources along with the requisite statistics and sample details.
Table 1. Data sources used for meta-analysis of ransomware payment rates.
| Stat | Source | Year | Method | Sample |
| 2.9% | Symantec report | 2012 | Empirical | 5700 infections |
| Notes: Based on a one-day sample of 5,700 unique IP addresses that were recorded connecting to the C&C servers. Out of those 5,700 connections, 168 people entered what appeared to be a valid PIN in an attempt to unlock their computer (2.9%). | ||||
| 0.4% | Dell Secureworks blog post | 2013 | Empirical | ~200K infections; ~ 800 payments |
| Notes: It is difficult to determine the sample details behind this statistic. SecureWorks references an external source that monitored payments to CryptoLocker Bitcoin addresses (see Fig 12). They also monitored sinkhole communications from ~39K infected systems. They estimate 200K-250K global infections. We’re assuming roughly 800 payments of 200K based on our best-effort interpretation of the details provided. | ||||
| ~34% | University of Kent study | 2015 | Survey | 1502 individuals; ~145 victims |
| Notes: Gives a 41% payment rate for CryptoLocker and an average of 30% for other types. Ransomware infection rate is 9.7% overall and 3.4% for CryptoLocker. The 34% shown here is a weighted average based on our understanding of these figures. | ||||
| ~46% | BitDefender report | 2016 | Survey | 3009 individuals; ~115 victims |
| Notes: This is a weighted average based on our interpretation of the country-level infection and payment rates from pages 2-3. This looks to be drawn from 110-120 victims from the 3000+ respondents (a 3.89% victim rate). | ||||
| 42% | Datto report | 2016 | Survey | 1100 organizations; ~1000 victims |
| Notes: This is based on MSPs relaying their experience with their clients. Thus, it’s impossible to discern exactly how many clients that covers. States 91% reported having clients affected by ransomware, so we’re interpreting that as approx. 1000 victims. | ||||
| 36% | Kaspersky report | 2016 | Survey | 12546 individuals; ~127 victims |
| Notes: Says 17% have come across, or been targeted by ransomware online, with 6% OF THEM falling victim to it as a result. We understand that to mean 6% of the 17% (~127) were victims rather than 6% of 12456. | ||||
| 37% | Malwarebytes / Osterman Research report | 2016 | Survey | 540 organizations; ~210 victims |
| Notes: Lists very different rates by country given on page 59 (e.g., USA=3%; Canada=75%). 37% appears to be the global average, and we assume that factors in the differing number of victims from each country. | ||||
| 38% | TrustLook blog post | 2017 | Survey | 210 individuals; ~21 victims |
| Notes: Only 17% of respondents were infected with ransomware (~35), so at most we’re talking 13 payers here (38% of 35). But it seems not all respondents answered that question, so it may be that only ~8 of 21 victims paid the ransom. | ||||
In addition to those identified in Table 1, we found several sources and statistics that we omitted from our analysis for various reasons. These are shown in Table 2 along with a rationale for why they were not included in our analysis. We include them partially for thoroughness and partially to show the many challenges inherent to this kind of analysis. It reinforces the lesson that even seemingly straightforward statistics and references can be hiding dubious reliability upon closer inspection.
Table 2. Data sources omitted from our meta-analysis.
| 30% | NYA International reference of TrendMicro estimate | 2015 or before | Unknown | Unknown |
| Rationale for omission: The NYA report attributes this stat to TrendMicro, but does not cite a specific source. We were unable to locate it or obtain the answer from the @TrendMicro Twitter account. Thus, we have no details on this sample and must treat as an anecdote. | ||||
| 0.5% | Trustwave report | 2015 | Estimate | N/A |
| Rationale for omission: This stat is found on page 67, but explained as a conservative estimate based on other sources that give payment rates ranging from 0.3% to 30%. Thus, not an original finding. | ||||
| 2.9% | Cisco report / Talos blog post | 2015/16 | Reference | N/A |
| Rationale for omission: This stat is found on page 13 and attributed to Cisco Security Research. We traced that back to a blog post from Talos on the Angler campaign. That post examines a large amount of data from Angler, but they attribute that particular stat to Symantec. Thus, we’ve already included it in our analysis. It is a good example of how original sources can become murky over the years and across organizations. | ||||
| 5% | Barkly blog post | 2016 | Survey | 300 organizations; ?? victims |
| Rationale for omission: Though the source states “95% refused to pay the ransom,” it is unclear how many respondents were actual victims vs just weighing in on whether they *would pay* if infected. It seems to be a mix and therefore unfit for direct comparison. | ||||
| 16% | CyberScout report (formerly IDT911) | 2016 | Survey | 1,035 organizations; 0 victims |
| Rationale for omission: Respondents stated they *would not pay if* infected, not whether they actually paid. Source didn’t explicitly state the other 16% said they would pay, but we’re making that assumption. We suspect this would result in under-reporting, but cannot verify. | ||||
| 2% | Das Bundesamt für Sicherheit in der Informationstechnik report (BSI) | 2016 | Survey | 592 organizations; Unknown victims |
| Rationale for omission: The 2% represents only 4 organizations claiming to have paid the ransom. 95% of respondents said they did not pay a ransom, but it is unclear whether all were victims. | ||||
| 24.6% | SkyHigh / Cloud Security Alliance report | 2016 | Survey | 209 organizations; 0 victims |
| Rationale for omission: Respondents answered whether they *would be willing* to pay, not whether they actually paid. We suspect this would result in under-reporting, but cannot verify. | ||||
| 34% | Symantec threat report | 2017 | Unknown | Unknown |
| Rationale for omission: This quotes a finding from the Norton Cyber Security Research Team, but does not cite a specific source. We were unable to locate it or obtain the answer from the @NortonOnline Twitter account. Thus, we have no details on this sample and must treat as an anecdote. | ||||
| ~0.1% | WannaCry outbreak | 2017 | Empirical | 400K+ infections; 337 payments |
| Rationale for omission: This is admittedly a special case, since the outbreak (and therefore payments) were interrupted by registration of the “kill switch” domain. Nevertheless, less than 0.1% of known victims have paid the ransom. Victim count tracked by @MalwareTech. Payment count tracked by @actual_ransom. | ||||
Meta-analysis of source material
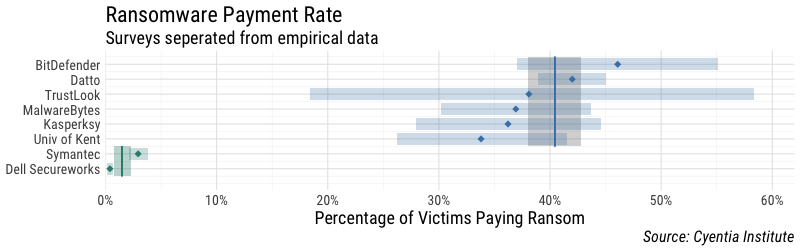
Scanning the statistics in Table 1 leads to the impression that TrustLook’s 38% isn’t all that out there. Or, if it is, at least it’s in pretty good company. Figure 1 strengthens that impression by placing all payment rate stats conveniently on the same chart. We’ve also added horizontal bars enclosing a 95% confidence interval around each point, the width of which is based upon the sample size (TrustLook’s being quite wide for reasons Tony’s post makes clear). The blue vertical bar represents the combined payment rate based upon the body of evidence found in Table 1 for surveys (40.4%). The shaded region around that line corresponds to our confidence around that estimate (+/- 2.4%). That the region around the combined rate is much narrower than that of any single source demonstrates the advantage of incorporating multiple perspectives into an analysis such as this–especially when individual sources have higher degrees of uncertainty.
Far to the left in Figure 1, the Symantec and Dell Secureworks marks might be missed at first glance. We’ve colored them differently to distinguish these empirical sources from those based on surveys for two reasons. First, they are slightly older; Symantec was conducted in 2012, and Dell in 2013. Second, they have a different set of potential challenges from surveys (e.g., convenience sampling from sensors that can’t see the whole picture). The comparison between the empirical data and survey responses is striking. Empirical research suggests a much lower 1.65% (+/- 0.8%) of ransomware victims give into the criminals’ demands. We didn’t include the WannaCry outbreak because its early interruption via the “kill switch” makes it an atypical case for studying payment rates. It’s worth noting, however, that it does side with the other empirical sources rather than the surveys.
We initially planned to combine all sources into a single rate/interval, but the disparity between empirical and survey findings precludes that approach. I suppose we could drop a line somewhere in the 15-20% range, but that would be kinda like predicting the election of a 3rd party candidate because the mainstream parties lie on opposite ends of the political spectrum. It seems less likely that the truth lies in the middle and more likely that one (or both) of the data collection methods are flawed in some way and thus failed to find truth at all.
The surveys shown here may (probably) suffer from any number of biases that result in respondents over-reporting the payment rate. For instance, asking “did you pay?” vs “would you pay?” seems to elicit very different answers (which is why we relegated the latter to Table 2). The empirical studies may suffer from convenience sampling and/or may not have visibility into all components of the payment chain, resulting in undercounting payments (i.e., perhaps missing some Bitcoin wallets to monitor). It’s also possible that large-scale events like CryptoLocker and WannaCry have below average rates because of the sheer number and scope of victims involved. We could go on, but you get the point — there are many potential pitfalls in research like this that can call the findings into question and make it hard to compare across methodologies.
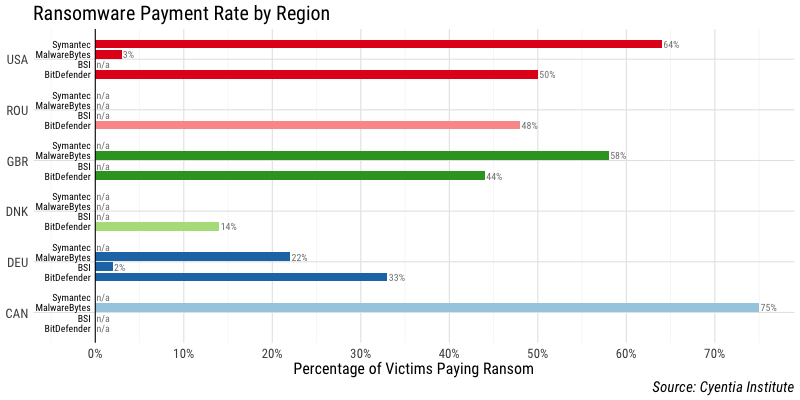
These issues are even more apparent when comparing regional statistics across the different sources in Table 3. We find it hard to resolve 61% min-to-max disparity among the sources for payment rates in the US are curious what circumstances cause that region to rank highest in the BitDefender sample but lowest in MalwareBytes. However, we can accept that 75% of Canadians end up paying the ransom–presumably because they don’t want to be unkind to the criminals by refusing, eh?
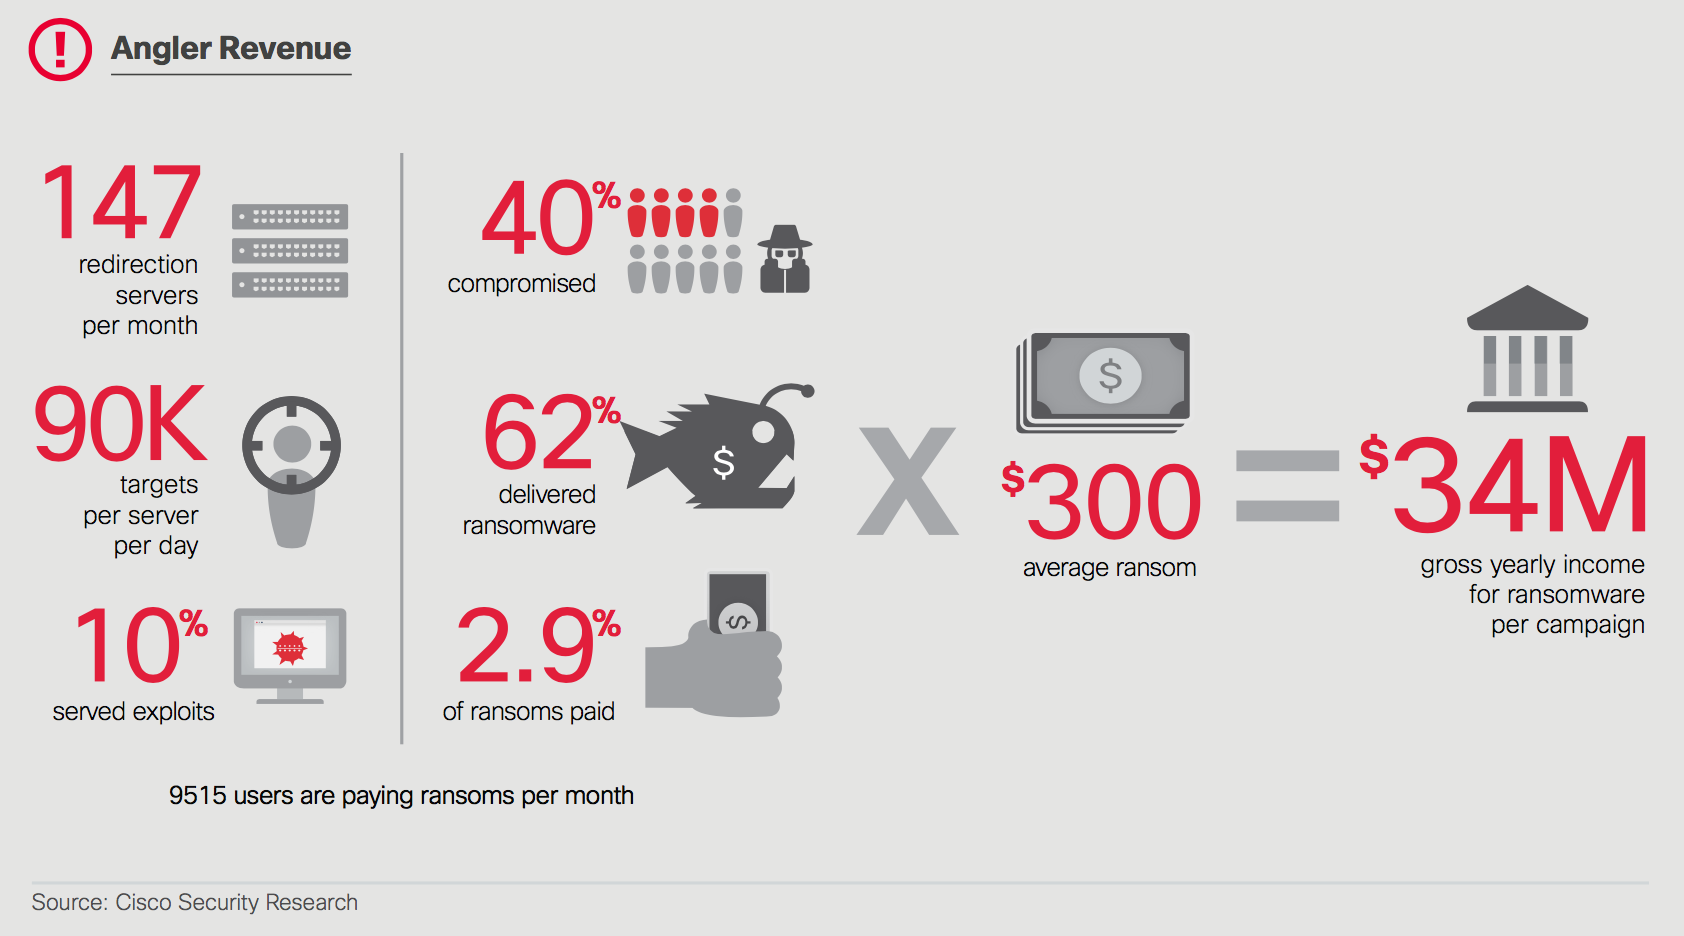
So where does that leave us on our quest for a ransomware payment rate and why does it matter anyway? Well, it makes a big difference when attempting things like assessing size of the ransomware problem relative to other cybersecurity threats. Take Figure 3, for instance, in which Cisco estimates the gross annual income for ransomware campaigns using the 2.9% payment rate from Symantec (which is based on one day’s worth of observations for one event 5 years ago, remember). If we swap in what the combined surveys say (~40%), that $34M shoots up near half a billion dollars. We’re not promoting that estimate, mind you–just sayin’.
As for where that leaves us, it’s hard to say. We regrettably don’t see “The One Answer To Rule Them All” amid the sources and statistics examined here. If the surveys are believed, payment rate is around 40%, but if you have more faith in the empirical , then payment rate is much lower, around 1.5%. What is clear is that we as an industry need to improve the way we conduct and communicate research findings. Is it reasonable to expect that empirical studies and surveys arrive at the same findings? I’m not sure, to be honest, but I’d ideally like to see them supporting the same general conclusions. Either way, we need to be very careful about the methods we choose and mindful of how those choices affect the outcomes. Since you can’t take away “A Number” to quote for ransomware payment rates from this post, we hope you can take away a good reminder/example of why numbers shouldn’t be accepted at their face value and how to vet them against multiple sources.
Next up in this series we will examine financial losses incurred by ransomware victims, including the seemingly ever-increasing ransom amounts.