This blog series is sponsored by Secure Systems Innovation Corporation (SSIC), a cyber risk advisory services firm that empowers business decision making. To learn more about SSIC and its support for this research, please visit their website and/or related blog post on this topic. Posts in this series: Part 1: Ransomware payment Rate; Part 2: Ransom Demands; Part 3: Ransomware Prevalence
This post will dive into the ransom amounts associated with ransomware, but before we jump into all the data around the money being demanded by ransomware attacks, let’s establish where we are. It’s probably safe to assume that the starting position for most everyone is “no idea.” Sure, we’ve seen estimates here and there from some of the security reports and blogs. For example, the sum of information from the 2016 Cisco Annual Security Report is that ransom amounts are “usually in the $300 to $500 range” (for the angler exploit kit). A report from NYA widens that estimate a bit, saying “The FBI and US CERT have observed ransoms between USD200 to USD5,000.” Another blog post from the Infosec Institute makes the claim that “The ransom demanded is usually less than $1,000.” While there is some variation there, at least we know it’s not something crazy like a million dollars, right? …oh wait.
We could also turn to headlines for an indication, but the amounts of ransoms reported generally do not align with what’s in reports. For example, Hollywood Presbyterian Medical Center was affected by ransomware on February 5th, 2016. Their EMR system(s) (and perhaps other systems) were unavailable for 10 days and they ended up paying 40 Bitcoin (about $17,000). The Lansing Board of Water & Light paid a $25,000 ransom to unlock its internal communications systems in April of 2016 and San Francisco’s light rail transit system was hit by ransomware and asked to pay about $73,000 in November of 2016.
Okay, so we have a lot of variation and uncertainty here. The good part of starting from a point of uncertainty is that any data we can gather from here on will help reduce that uncertainty. Afterwards, we’ll hopefully be smarter than we were before (which is really the point, right?).
First, we should address the discrepancy in the first two paragraphs. The industry reports generally agree the ransom amounts are less than $5,000, but we have several real events where the ransoms easily surpassed all the industry estimations. Why is that? The explanation is relatively simple: ransomware is generally priced on a per-infection basis. Most of the industry reports are studying individual ransomware instances and what ransom amounts are associated with them. However, in reality, ransomware often infects more than a single host in a corporate environment. So the resulting real-world ransom is going to be the base ransom demand the industry reports are citing, multiplied by the number of hosts affected, minus any discounts the victim manages to negotiate. We also have that outlier case we linked to at the end of the first paragraph, where a South Korean ISP paid a ransom of $1m. That’s very unique because it was targeted at that victim and the ransom was customized. Conversely, the majority of ransomware appears to be opportunistic based on what little evidence we’ve seen on that subject. The per-instance (an instance being each individual infected system) ransom demand is where we should start our discussion of opportunistic ransomware.
Per-Instance Ransom Amount
Talking about the per-instance amount may be tricky because it varies across malware families, ransomware variants, and in some cases, by which day someone looks. This means we will be trying to describe a distribution of ransom amounts and this is where things get a little tricky. For most people, the knee-jerk reaction to a distribution is to calculate the average (arithmetic mean) and use that to represent the whole of the distribution. We will avoid that altogether for a variety of reasons, but mainly because oftentimes the exposure that will drive risk-based decisions will be at the tail end of a distribution and has nothing to do with the median, mean or whatever central point there is.
Choosing not to rely on summarizing statistics limits the sources we can draw on considerably (yeah, looking at you, industry report creators), but luckily for us Symantec published an appendix in their 2016 report “Security Response: Ransomware and Businesses.” They listed out 75 ransomware variants with 56 of those listing ransom amounts. As a side note, 86% (48 of 56) of the ransom amounts were requested in Bitcoins, which were converted to USD using the average price for bitcoin in the month it was identified. The following chart shows the distribution of ransom demands across 56 ransomware variants identified by Symantec.

We could do some simulations here and estimate the total ransom amount given a system count, or we could keep it simple and understand that 95% of the density of ransomware amounts is between $4 and $1,300, with an expected value around $525. If you would like to estimate what happens if 20 systems fell victim to ransomware, 95% of the time the ransom would be between $80 and $26,000, with a most likely amount around $10,000. Another way to think of that is that there is a 1 in 40 chance (2.5%) the ransom will exceed <number of systems> x $1,300.
But in reality…
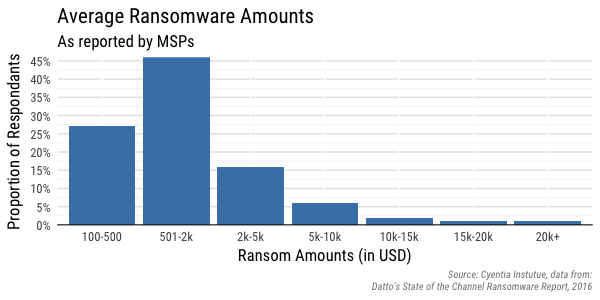
We found two relatively recent surveys asking about and aggregating ransomware amounts. The first we’ll look at is from Datto’s “State of the Channel Ransomware Report, 2016.” It is unfortunately somewhat slim on details, but Datto surveyed 1,100 Managed Service Providers (MSPs) globally. They asked, “On average, how much ransom is requested?” and allowed the respondents to select from predetermined range of answers. Note they don’t collect any sort of data about specific events or victims; they are just asking MSPs what they estimate the average loss to be (and we’ll leave that statement as is).
The second survey is from MalwareBytes (conducted by Osterman Research) focusing on respondents from four different countries (U.S., Canada, U.K. and Germany). Like the survey from Datto, they show the ransomware amounts as values within a range of ransom amounts, but it’s spread across four different sections. We did our best effort[1] to combine the four different country charts into a single chart and show an estimate of the overall ransomware amounts.
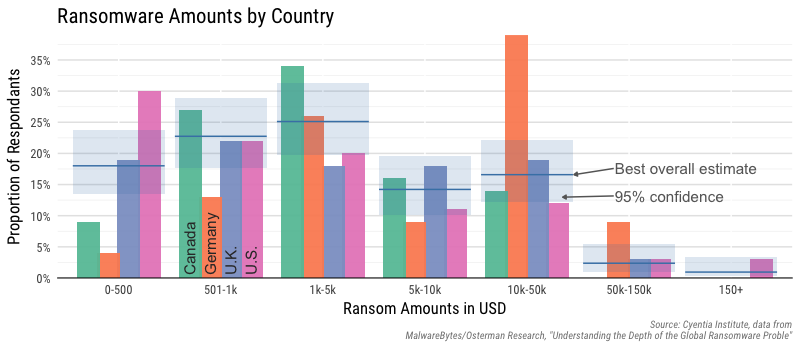
Just eyeballing the chart, there is only a little differentiation across the first three categories, but a couple of other points come to mind. First, we don’t know if this is asking total ransom amount or a price-per-infected machine. Based on the data we’ve looked at, chances are this is an aggregated total for all infected machines and the values to the left are probably single-infection events. Second, and this is a bit subtle, but the cut-off points for the categories are a bit odd–sort of a mix between a linear and log scale. But if you can visualize the ranges presented, it becomes clear there are some rare events and the distribution of losses is skewed, making any average (mean) a troubling estimation of losses.
Okay, so now what?
Now that we have some information about two different distributions of ransomware amounts, we can use them to estimate something called a loss exceedance curve. This is a visualization tool to look at the “tail risk” of an event and is often used in quantitative risk analysis and insurance modeling to communicate the probability of losses exceeding some amount. An exceedance plot will show the probability on one axis and a loss amount (or in our case ransomware amount) on the other axis. If this is a new concept, searching on terms like “loss exceedance curve” or “exceedance probability” will give you way more information than we are able to provide here. Just know that this plot often helps in the decision process because it sets up a discussion around probability and the extreme events.
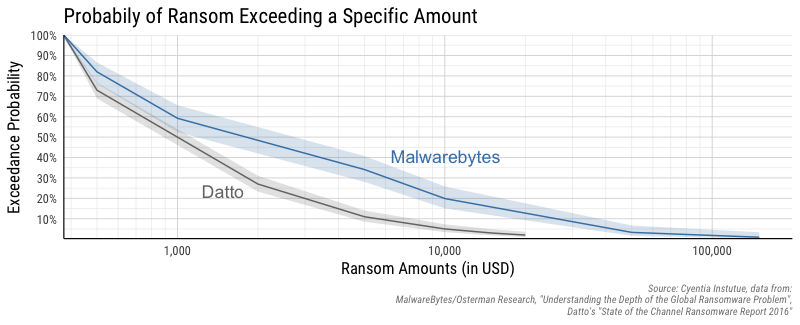
Keep in mind that this chart is useful for a single ransomware event and doesn’t factor in the prevalence of ransomware events. Once a victim experiences a ransomware event, this chart attempts to capture the expected ransom amounts. Now let’s walk through a couple of examples in reading this chart. According to Datto, there is a 50% chance the the ransomware amount will exceed $1000 (plus or minus the shaded region), but the data from Malwarebytes puts that at a 50% chance of exceeding about $2000 (note, the x-axis is on a log scale). If we want to look at a 1 in 10 event (10%), Datto’s study estimates just under $6,000, but Malwarebytes says there is a 10% chance of exceeding $25,000 in ransomware demands. Unfortunately, neither study is very forthcoming in their methodology, so it’s hard to say if one is more trustworthy than the other. But anecdotally, the ransomware events tends to push me towards trusting the numbers from Malwarebytes more than Datto’s numbers.
Bringing it home
Finally, and we didn’t touch on this at all, but the ransomware amounts are just one of many possible losses during a ransomware attack. The encryption of data undoubtedly means availability of your systems will be affected and then you’ve got productivity loss, opportunity costs, recovery costs and other ways the event can impact the business. But most of those losses would be common to availability events like DDoS, power outages, hardware failure, etc. and so we leave that as a topic for future research.
Footnotes
[1] We factored in the response rate from each country with the estimated proportion of respondents affected by ransomware. Then worked backwards from the percentages in each country chart to estimate the count in each country for each category and calculated a 95% confidence interval (with Wilson’s score interval).