
Upcoming Webinar!

Sign up today to get exclusive webinar content from our in-depth, monthly discussion with the team!
Join us for July’s webinar on the 20th at 2PM EST – Prioritization to Prediction: Greatest Hits! Our experts, Wade and Jay, will guide you through an insightful journey, discussing the most remarkable highlights from the past 8 volumes of our groundbreaking reports we developed in collaboration with Kenna.
Known for their expertise in vulnerability management, Wade and Jay will provide in-depth analysis and valuable insights derived from years of extensive research. This is a unique opportunity to tap into their wealth of knowledge and gain a comprehensive understanding of the key findings that can enhance your vulnerability management efforts and maximize risk reduction.
Don’t miss out on this engaging session with Cyentia as we unravel the key takeaways from our report’s vast collection of insights. Register now for the webinar and mark your calendars to join us for a discussion that will enhance your approach to vulnerability management.
Stay tuned for Volume 9, scheduled for release later this year, and ensure you stay up-to-date with the latest advancements in vulnerability management research. Take the first step in transforming your cybersecurity strategy by reserving your spot in this must-attend webinar.
New Article!
Patching, Fast and Slow
Author: Wade Baker
Fair warning: This post summarizes years of in-depth research on vulnerability remediation rates. There’s no way to do justice to all the ins and outs of that research… but I’m gonna do my darnedest to hit the highlights. There are hundreds of published pages to dig into if you think I’ve brushed over too many details (I kinda hope you do, honestly).
There are many ways one could measure how quickly vulnerabilities are patched. Most go with a simple average, but as Jay recently posted, such point statistics are a poor representation of what’s really happening with remediation timeframes.
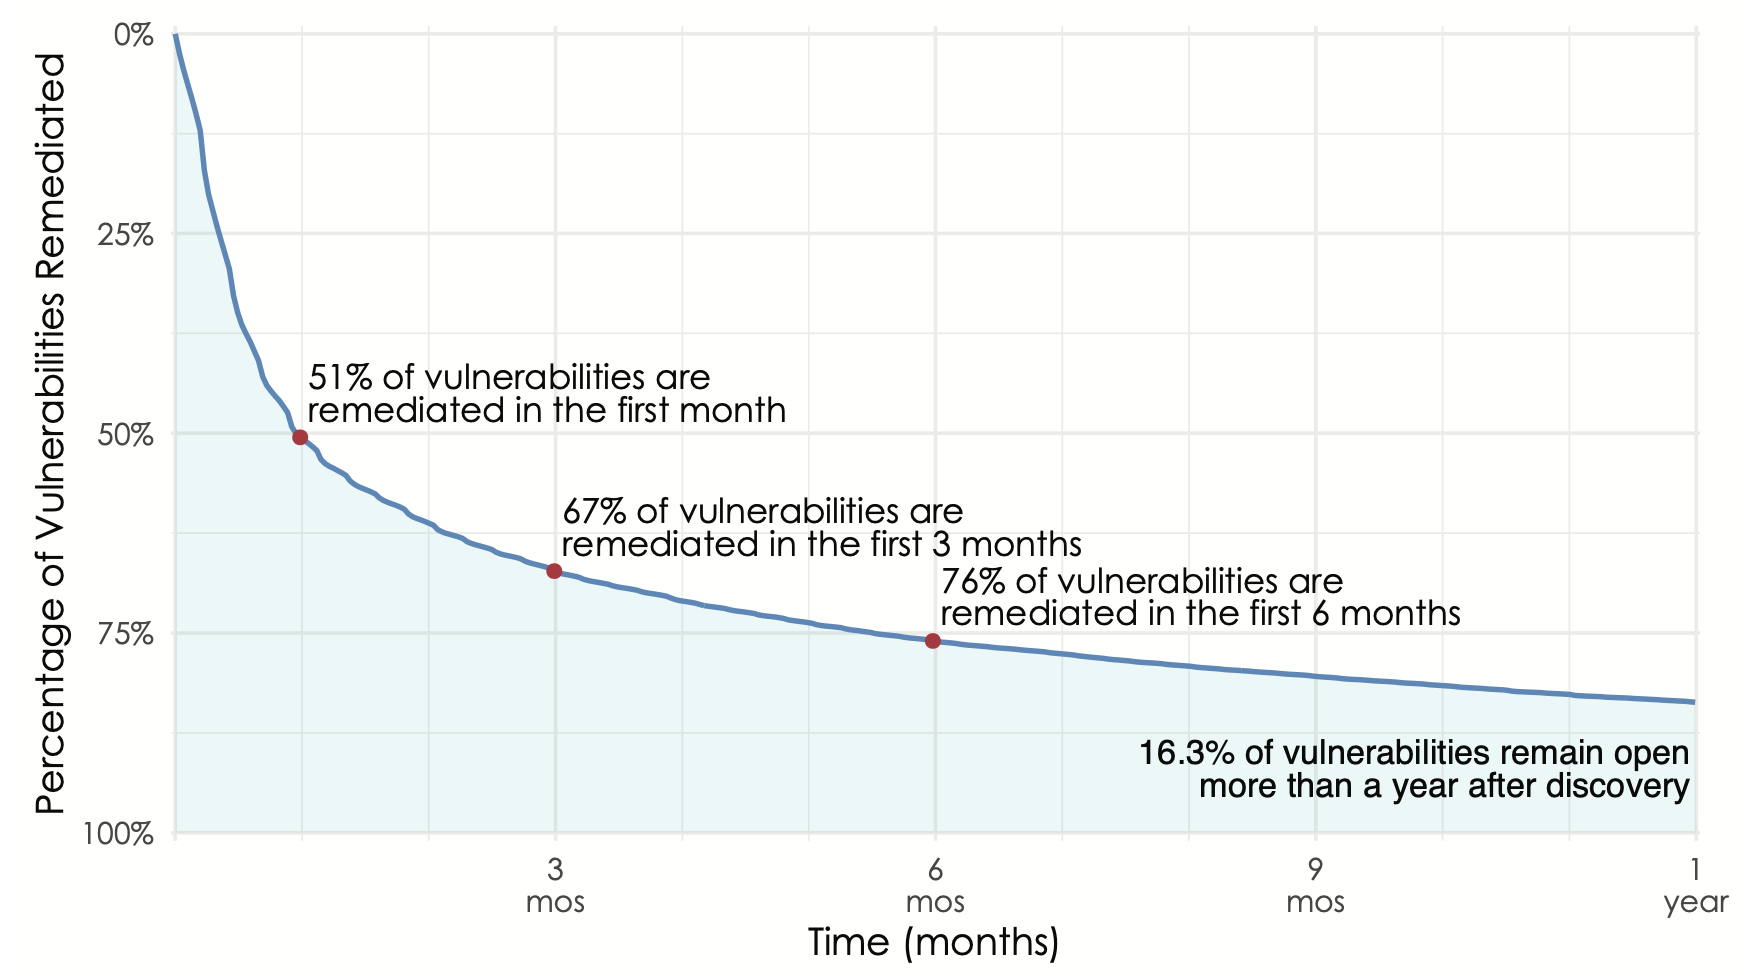
Overall remediation velocity across active assets for all firms and vulnerabilities.
Our favored method for this is survival analysis. I won’t get into the methodology here other than to say it tracks the “death” (remediation) of vulnerabilities over time to produce a curve that looks like this. Those wanting a single stat can just go with the half-life (50% closed in the first month), but others will appreciate the shape of the curve that illustrates the long tail of remediation (16% of vulns open for more than a year).
An overall survival curve this grants useful insight, but even more so when we compare them among different groups of vulnerabilities. Let’s do that for vulns affecting Microsoft platforms, Mac OSX desktops/laptops, Linux/Unix systems, and network appliance/devices. Here we can see that the half-life of vulnerabilities in a Windows system is 36 days. For network appliances, that jumps tenfold to 369 days – a 10X difference! After one year, only about 15% of bugs remain on Mac and Windows assets, but Linux/Unix systems and network appliances still have a lot of work ahead of them. Based on this information, an organization may wish to tailor remediation priorities, processes, and SLAs by asset type.
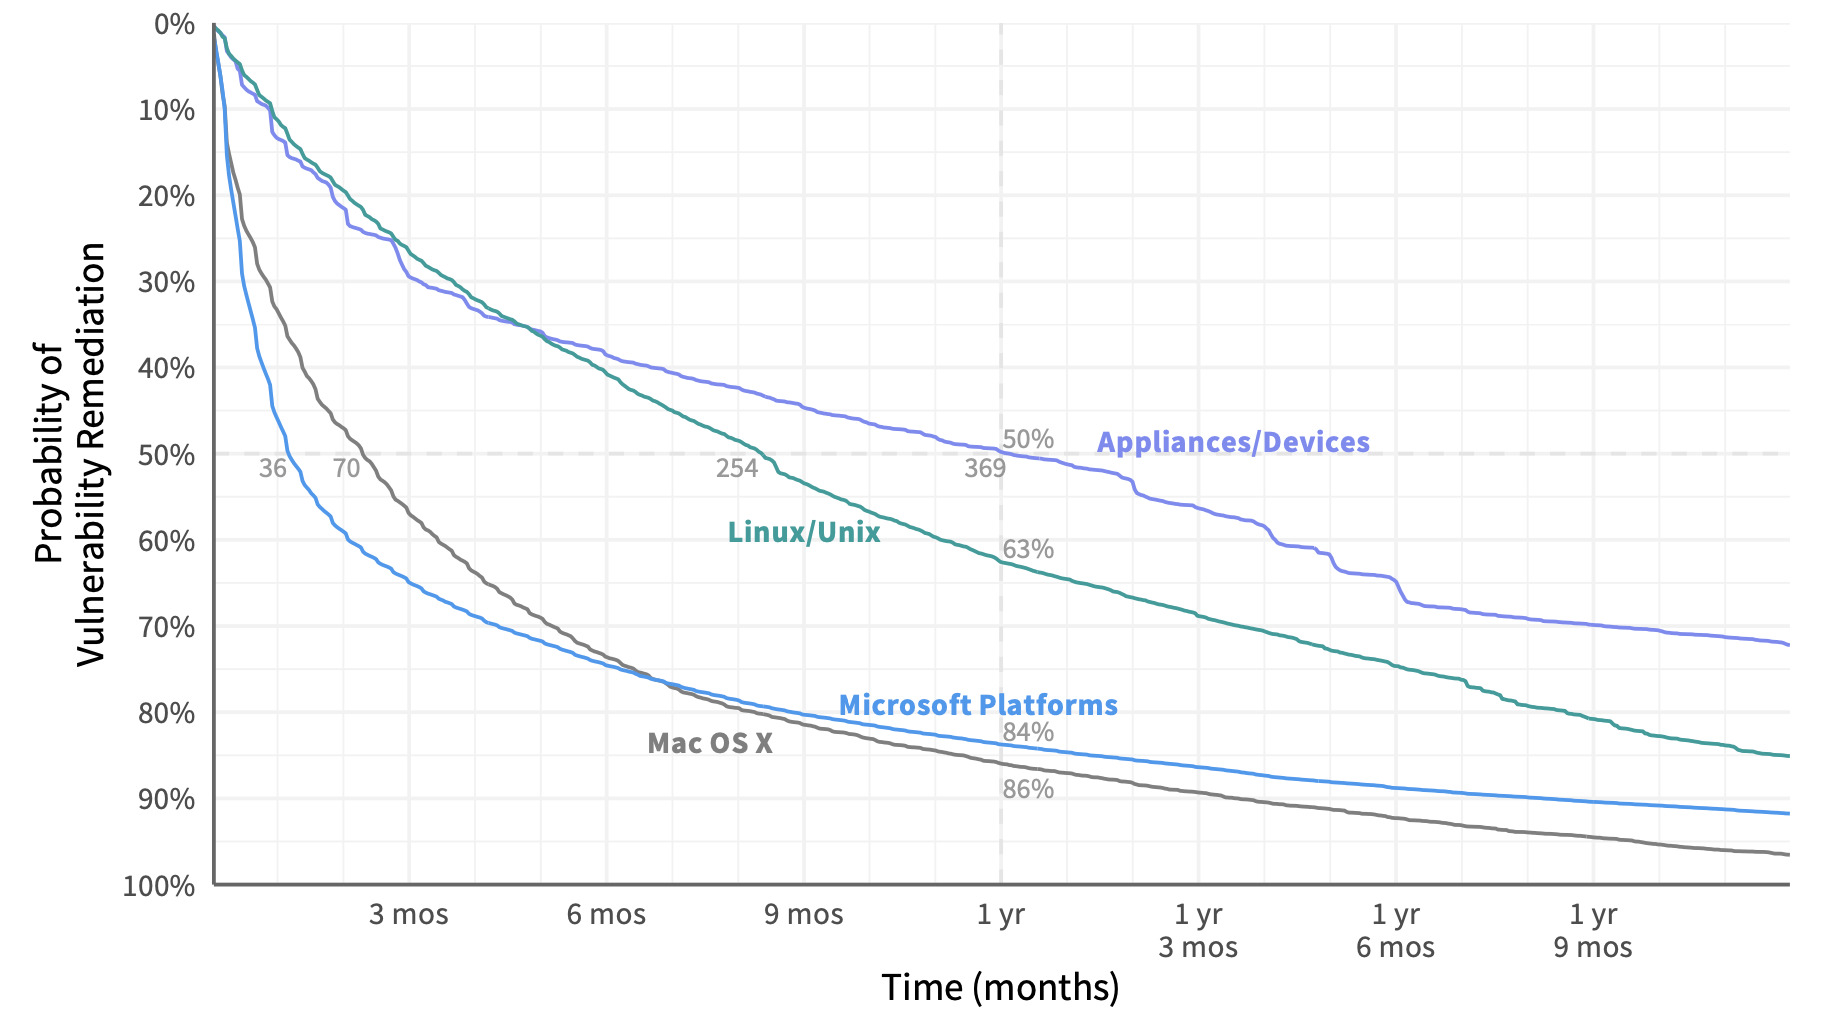
Comparison of remediation velocity across major asset categories.
But we can go even deeper into the remediation rabbit hole.
Let’s split out that vuln survival curve for Microsoft for different versions of Windows to see what we can learn.
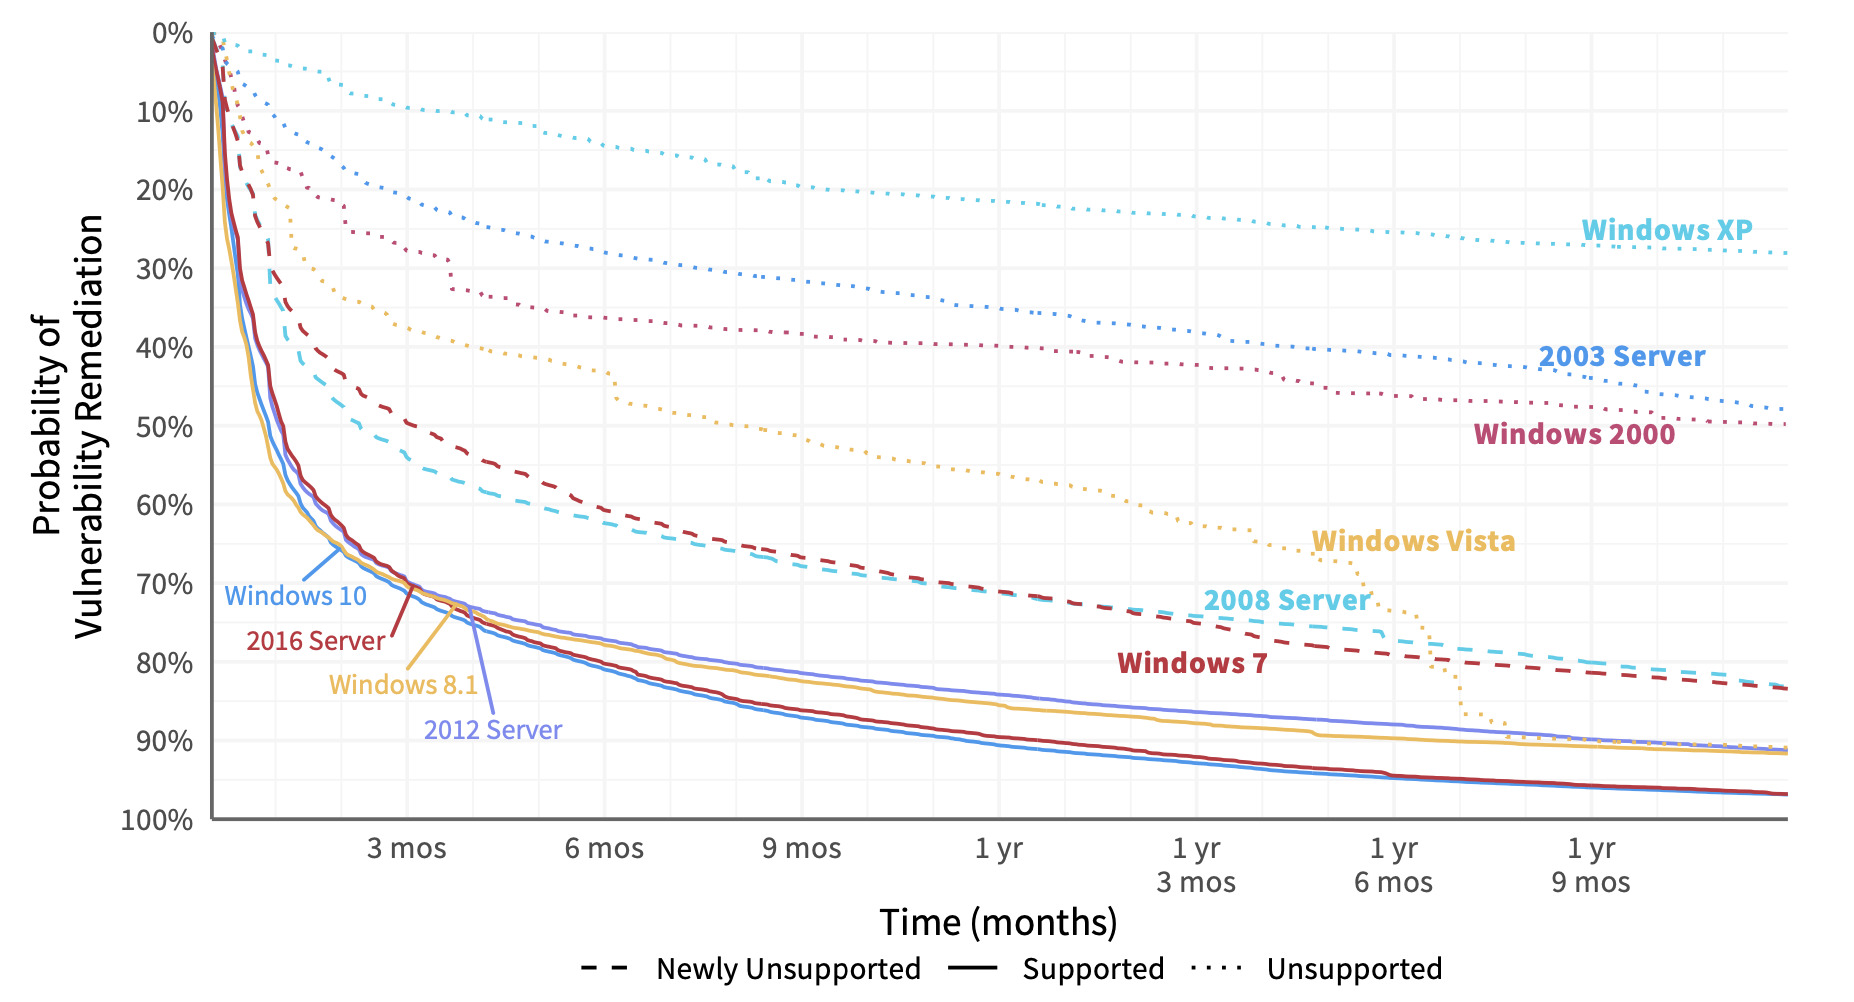
Comparison of remediation velocity across Windows platforms.
The newer versions of Windows (at least when we created this chart a few years ago) cluster at the bottom with steep, convex curves conveying fast patch deployment. Unsupported versions (indicated with dotted lines) languish along at the top. Clearly, that milestone in a platform’s life makes it much more difficult to manage vulnerabilities in a timely manner (or even at all). Mainstream support had ended for the dashed-line versions in the middle when we pulled this data, but extended support was still available at the time. If you’re looking for data to show upper management that squeezing a little more life out of those legacy Windows servers and desktops is a bad idea, this should do the trick.
Oh! oh – I know. Let’s see if vulns with high CVSS scores are remediated faster than those with low scores. Surely so, right? Right? Uh, wait a tick…vulns with the lowest CVSS scores (0-3) are fixed the fastest, while 10’s are among the slowest. Here’s my shocked face (°0°)
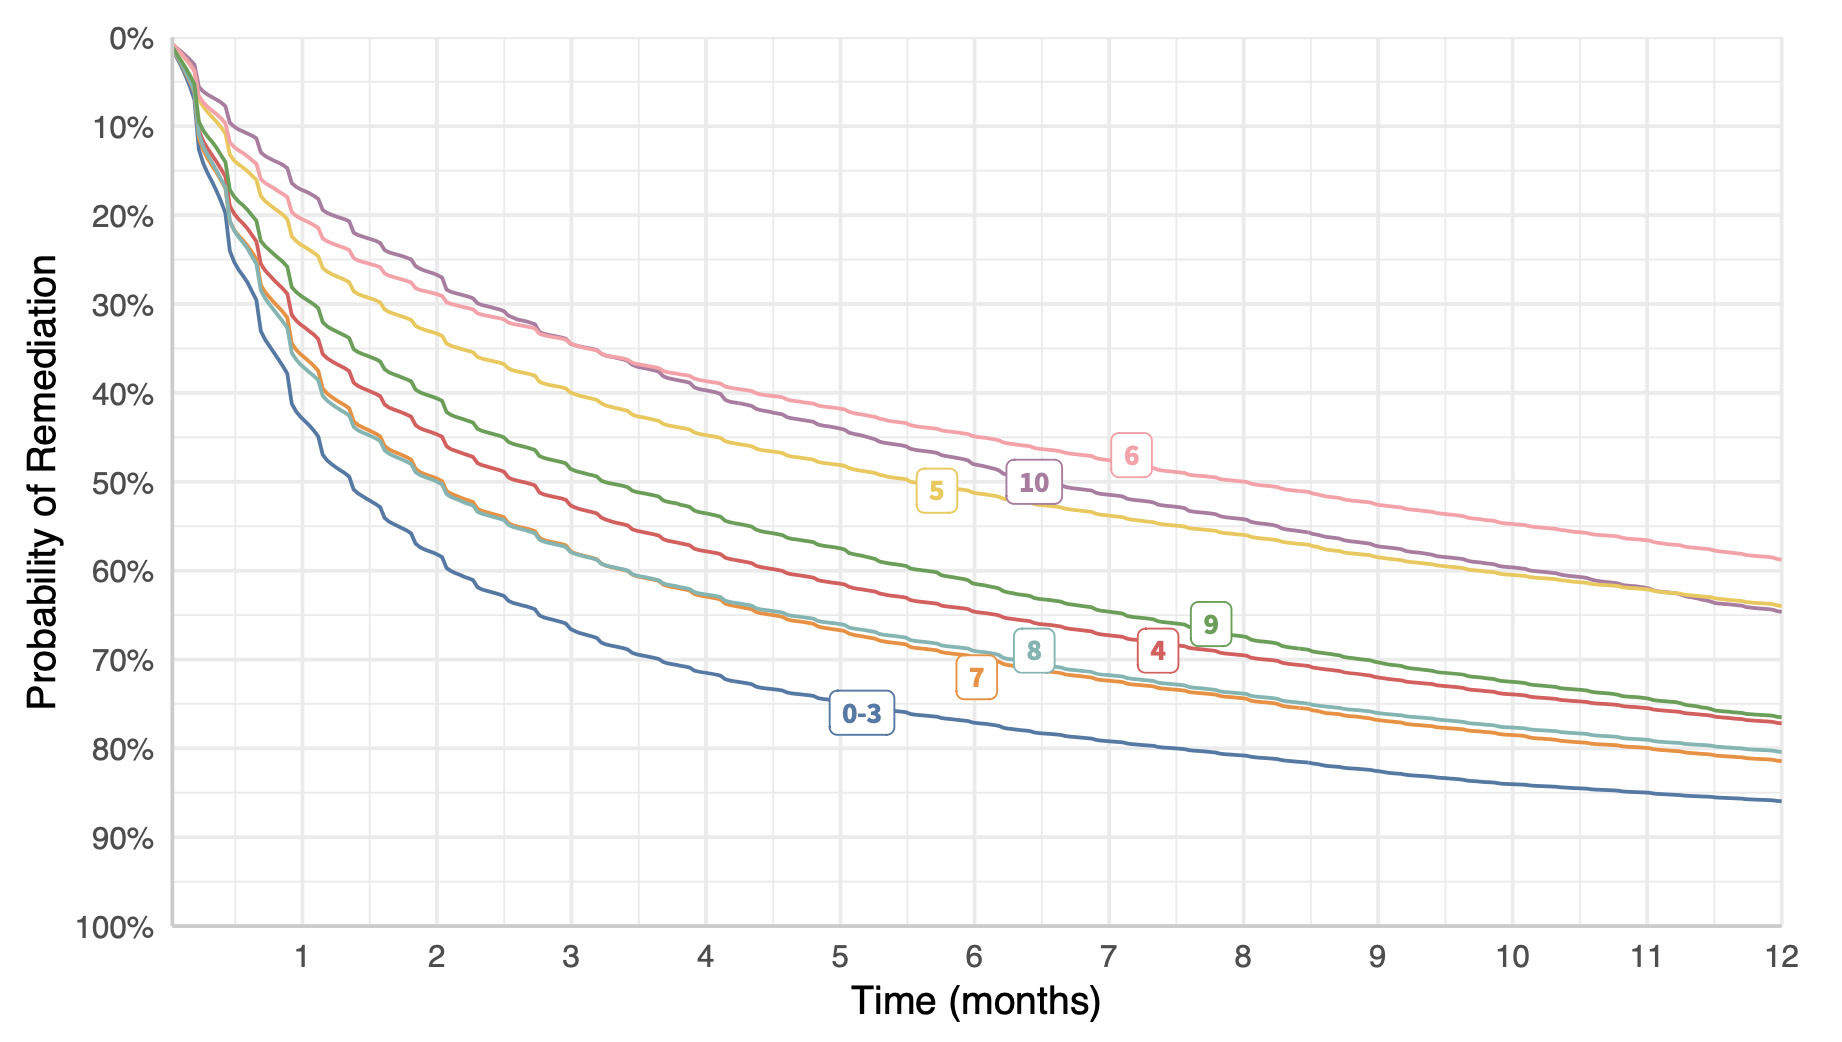
Comparison of remediation velocity by CVSS score.
That’s probably enough. Hopefully, you can see that we could take any grouping of vulns, create a survival curve, and learn something interesting and/or useful about remediation. But we can also use this technique to compare different organizations or firmographic slices. Here’s a giant hairball of a chart showing remediation timelines for individual organizations across all their vulnerabilities. I advise against trying to make visual sense out of it – just take away the point that some organizations patch really fast, while others are really slow. And maybe wonder what differentiates them.
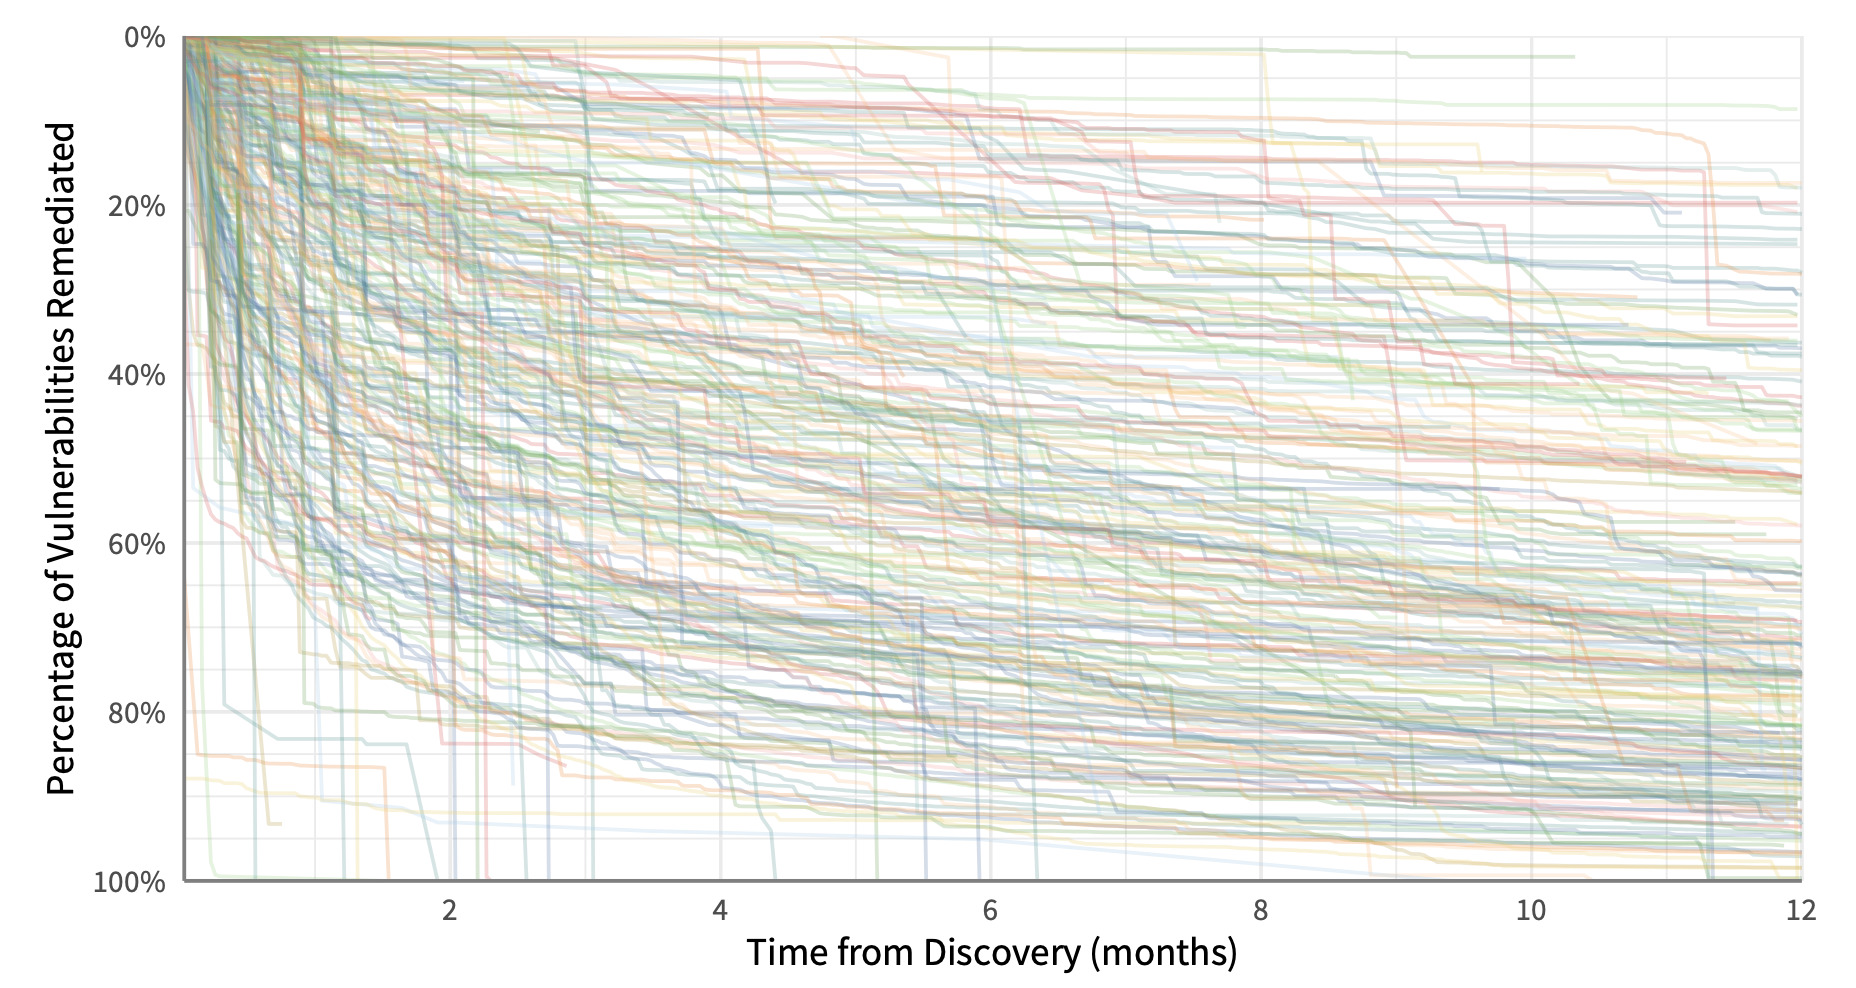
Individual vulnerability survival analysis for each firm. You are not supposed to be able to read this.
Let’s see if we can clean that up a bit.
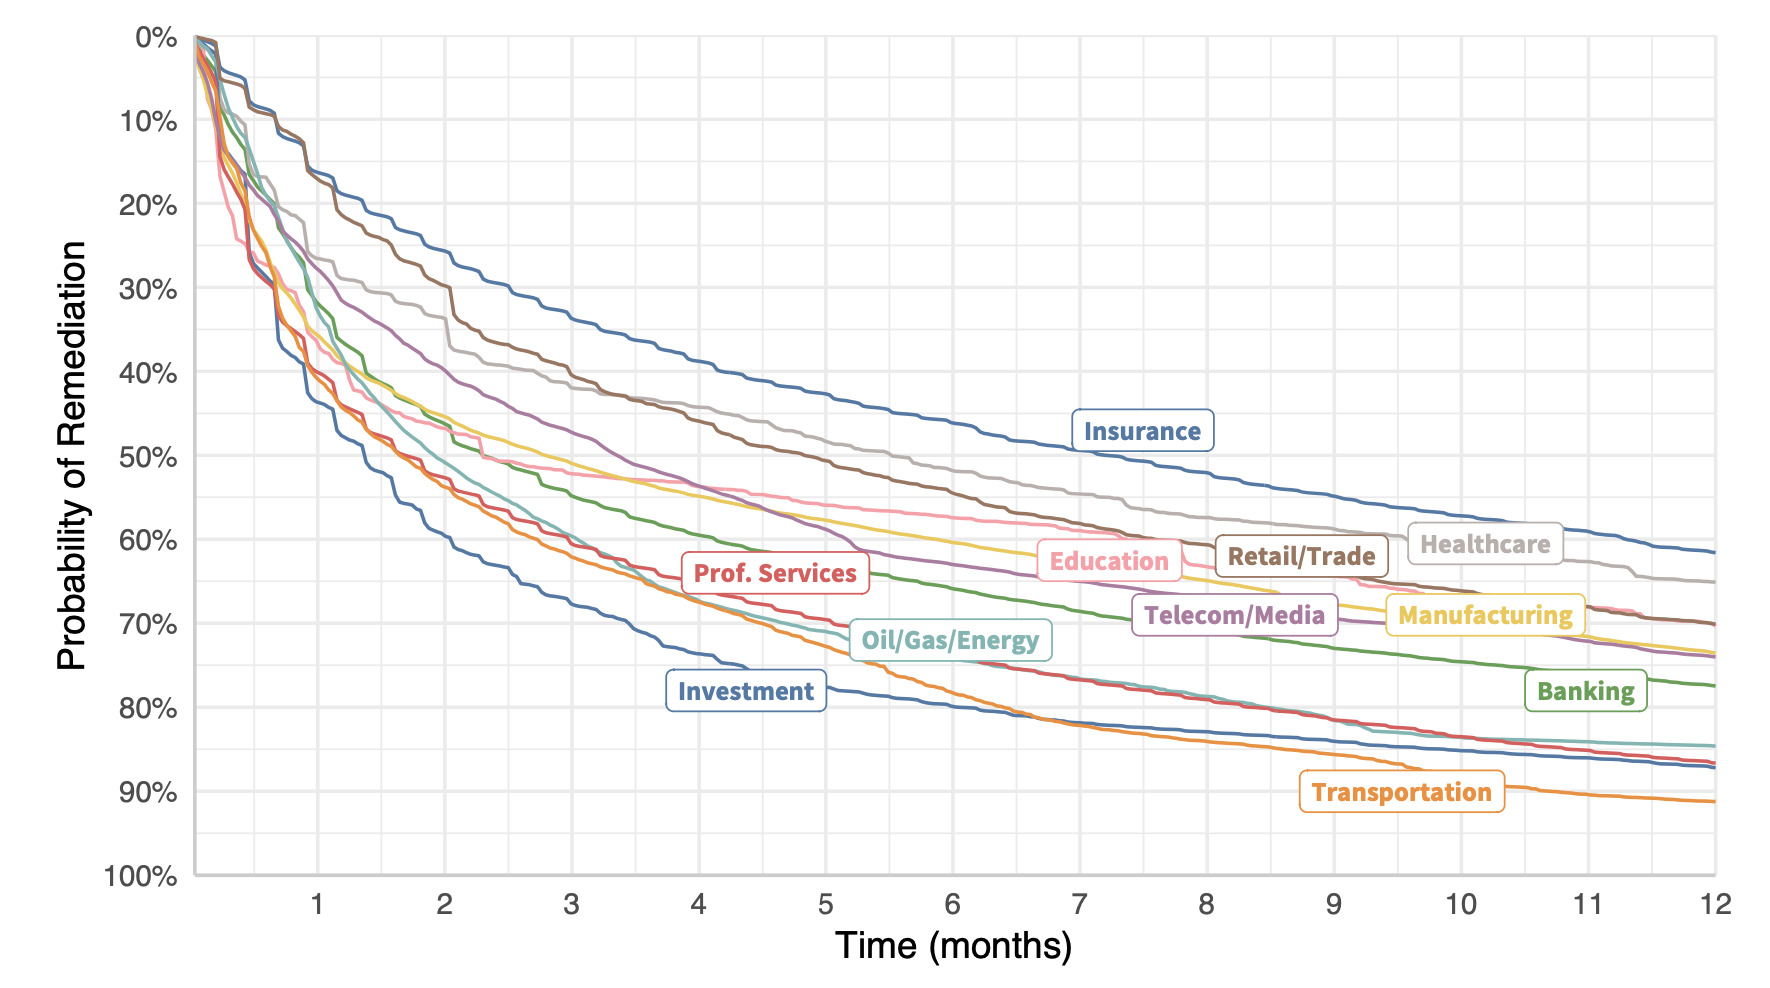
Remediation velocity by industry (all vulnerabilities).
Creating vulnerability survival curves for organizations in similar sectors yields the chart to the side.
The lesson? Get remediation strategy advice from your investment firm rather than your insurer, perhaps? We could ask a bunch of other questions about why certain types of organizations struggle more than others to address vulnerabilities…but this isn’t that post.
We can also compare remediation rates across different sizes of organizations. But I’ll need to change the format because I don’t have the curves created for this one. The chart below uses the same method of survival analysis but condenses the presentation to highlight how long it takes to close 25%, 50%, and 75% of open vulns. I find this one interesting, because there’s not much difference in fix speeds between small, medium, and large organizations (based on employee size). Large orgs certainly have more resources to throw at the patching problem…but they also have a lot more stuff to patch.
There’s a second aspect to this chart because it also compares remediation velocity for vulns with known exploits vs. those with no known exploits. Note that the gap is widest for large organizations. I suspect that’s because they have more vulns vying for attention and need to prioritize those that matter most.
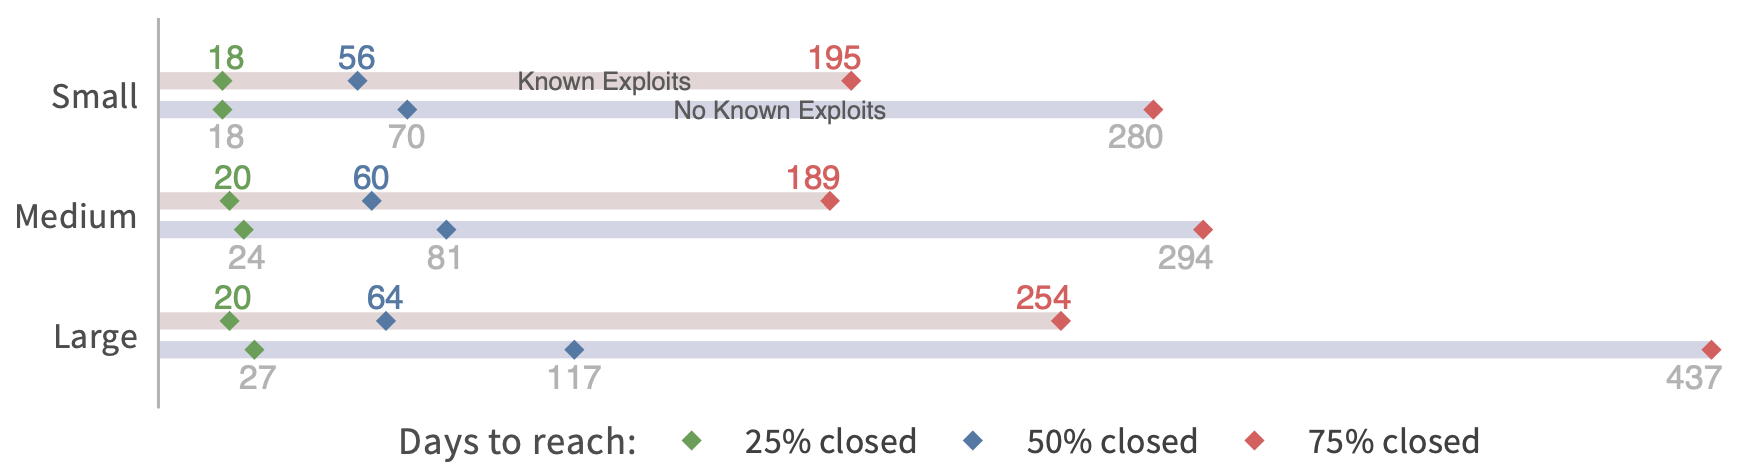
Comparison of remediation velocity by organization size.
They defer remediation of non-exploited vulns for hundreds of days in order to focus on the riskiest ones.
That’s a smart strategy.
System 1 and System 2 Patching
You may have caught the title of this post being a reference to Daniel Kahneman’s book “Thinking, Fast and Slow.” That was partly because it’s catchy and fits the topic. But I also think there’s a parallel to be drawn from one of the main points of that book. Kahneman describes two basic types of thinking that drive human decision-making:
System 1: Fast, automatic, frequent, emotional, stereotypic, unconscious
System 2: Slow, effortful, infrequent, logical, calculating, conscious
Maybe you see where I’m headed here. I’m not saying we can boil all patching down to just two different approaches. But my experience and research support the notion that there are two broad systems at play. Many assets lend themselves to automated, fast deployment of patches without much additional preparation or evaluation (e.g., newer versions of Windows and OSX). But others require manual intervention, risk evaluation, or additional effort to deploy. The more your organization has to engage in System 2 patching, the slower and shallower those remediation timelines will appear.
My takeaway for vulnerability management programs? Use System 1 patching as much as possible and System 2 patching only where necessary.
***
Note: All of these charts come from published volumes in the Prioritization to Prediction research series between Cyentia Institute and Kenna Security (now Cisco). I’ll link to Volume 5: In Search of Assets at Risk, since more charts came from that one than any other.
Read the New Blog Posts!
Your concise look into our recently published articles.
¾ of Century of Cybersecurity Solitude
Author: Ben Edwards
For me, cybersecurity can seem small. Beyond my community of friends and colleagues, all I can see is a cyber world that is a mirrored reflection of a reflection of repeated activities. Attack. Defend. Analyze. Adapt. Attack. Defend. Analyze. Adapt. While the attackers are generally conceived as US foreign adversaries(1), the rest of the cycle is decidedly American (or at least western). Without self reflection the daily view can become myopic.
This probably feels familiar to many in the cybersecurity community. After all, since the mid 50s, early phone phreaks (arguable the first hackers) like David Condon were tricking the American-as-apple-pie Ma Bell(2). Indeed, the majority of the infrastructure and software that was to be hacked and secured was US based. But how much of our world is self constructed, mirrored glass, showing our own reflection over and over again, oblivious to the outside world?
Here, I’d like to talk more about what I learned from the attendees and other experts…
Why your MTTR is Probably Bogus
Author: Jay Jacobs
Confession time… every time I hear someone cite a statistic around “mean (or median) time to remediate (MTTR)” within cyber security, I have a wave of skepticism wash over me and I find myself questioning the MTTR statistic, adding to my skepticism is a general lack of transparency about how it’s calculated. Now, I’ve been generating and consuming cyber security statistics for many years now so this is a hard-earned position of skepticism that has built up over my career. Because here’s the truth: generating the mean time to remediate is not an easy calculation and most often can only be estimated or approximated.
Hopefully we can walk through an example together because I come bearing data. I started with 3.6 billion (yeah, billion with a “b”) observations of vulnerabilities on assets across hundreds of organizations courtesy of our research partnership with Kenna (now Cisco Vulnerability Management). Nobody wants to go through that amount of data for a simple walkthrough, so I derived a representative sample. However, it doesn’t really matter if it is representative, it could be totally random data because this is just an example. But I figured it’d help build our intuition if it was as close to real data as possible. So grab the data and before you read on, maybe try to calculate the MTTR as you think it should be done.
Got an MTTR? Okay, let’s continue…
The first few rows of the data are shown in the first table and there are 1000 rows (observations) and 2 variables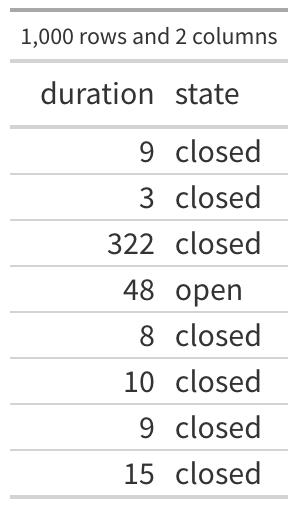 (columns) in this data. There are 750 observations of closed vulnerabilities and 250 observations of vulnerabilities that were still open when we collected that data (roughly 23.7% of my 3.6 billion observations were still open). The first observation in the table says that a vulnerability was seen for 9 days and then it was closed, the third one was open for 322 days and closed, the fourth observation was open for 48 and as far as we know, it is still open. So all we know is that particular vulnerability was open at least 48 days.
Before we jump into the calculations, let’s set a frame of reference here. The purpose of “MTTR” is to establish some type of expected, central timeline for a vulnerability to be closed. If I observed a single vulnerability and I know the MTTR, I could assume this one vulnerability will be closed on or around that MTTR, right?
Okay, let’s see what we can estimate…
Quantify, Analyze, Protect: IRIS Risk Retina Reports for Effective Cyber Risk Management
Author: Carolyn Gimarelli
Accurate risk analysis and quantification can be a daunting challenge for risk managers. The lack of reliable data on cyber risk factors often leads to fear, uncertainty, and doubt (FUD) surrounding risk assessment decisions. But now, with IRIS Risk Retina, businesses have access to customizable analytical reports that provide real-world data to support cyber risk quantification.
Explore the significance of IRIS Risk Retina and dive into the highlights about our available IRIS Risk Retina series designed to empower organizations to make informed decisions and enhance their cybersecurity strategies.
Available Risk Retina Reports
Non-Profit: Discover the insights and statistics behind cybersecurity incidents in the nonprofit sector with the IRIS Risk Retina for the Non-Profit Sector. Analyzing a decade’s worth of data from January 2012 to December 2021, this comprehensive study sheds light on the cyber risks faced by nonprofit organizations today.
Transportation Sector: Gain valuable insights into the cyber risks faced by Transportation firms with our comprehensive report, “IRIS Risk Retina Transportation.” Spanning a 10-year period from January 2013 to December 2022, this study analyzes 670 loss events to provide key statistics for cyber risk quantification.
Financial Services: Discover the insights you need to quantify cyber risk in the financial industry with our comprehensive IRIS Risk Retina® for Financial Services Sector. Over a 10-year period from January 2012 to December 2021, we analyzed 7,950 loss events, providing you with key statistics to understand and manage present-day risks.
In addition to the main IRIS Risk Retina for the Financial Services Sector, we also have two addendums available now! Gain a deeper understanding of the intricacies within the Financial Services sector with our comprehensive analysis. The first addendum delves into the Credit Intermediation subsector (NAICS code 522), utilizing the latest Advisen data from February 27, 2023. In the second addendum, we explore the Insurance subsector (NAICS code 524), providing additional resolution and shedding light on its distinct features within the broader Financial Services landscape.
Our goal is to empower users with a granular understanding of these subsectors, enabling informed strategies and proactive risk management.
Information Services: Gain valuable insights into cyber risk quantification in the Information Services sector with our comprehensive IRIS Risk Retina® for Information Services Sector. Spanning a 10-year period from January 2013 to December 2022 and analyzing 3,125 loss events, this report offers key statistics to help you navigate present-day risks.
We also have published the IRIS Risk Retina Telecommunications Subsector Addendum, a powerful supplement to our comprehensive Information Services sector report. This addendum, leveraging the latest Advisen data from February 27, 2023, offers invaluable insights and enhanced resolution specifically tailored to the Telecommunications subsector (NAICS code 517).
Cure Your F.U.D.
Continue reading the full article on our website!
To access these valuable reports and take the first step towards enhancing your cybersecurity posture, contact us to request the specific reports that cater to your industry.
Explore more articles written by the team! 📖
Exploring Exploit Intelligence Service (EIS): Tracking Exploit Code
It has been quite a while since we have done an update on published exploit code tracked in Cyentia’s Exploit Intelligence Service. The primary purpose of the feed is to identify and monitor exploit code being published, though as we will see in part 2 of this post, there are other interesting data points in the feed.
There are three primary (and recent) sources for exploit code: Metasploit, Exploit DB and GitHub. But the three sources are not created equal and each source has strengths and challenges. First of which is the amount of exploit code being published there. Over the last three and a half years, GitHub has been the place to quickly publish exploit code. Anyone can post, there are no quality checks (which is a strength according to the author and a challenge for any consumer), and sharing is instantaneous….
The Hidden Complexity of Vulnerability Remediation: Bridging the Gap between Data and Common Advice
For two decades, I’ve heard security professionals urging organizations to “just patch your stuff” as though they don’t already know that and/or it’s as simple as saying those words. This is where real data and “thought leaders” differ. The data acknowledges that things aren’t so simple in the real world because vulnerability remediation is a moving target (new vulns are found as old ones are fixed).
We measured the remediation capacity of hundreds of organizations over a 12-month period. To do this, we calculated the total number of open (unremediated) vulnerabilities in the environment and the total number closed each month. We then averaged that over the active timeframe to get a monthly open-to-closed ratio for each organization and created a log-log regression model. The results are recorded in the figure below, where each organization is plotted along the grid. And those results are INSANE!…
Strengthening Healthcare Security: Optimizing Vulnerability Remediation with IRIS Risk Retina
In an era where the healthcare industry faces unprecedented cybersecurity challenges, safeguarding patient data and ensuring the integrity of critical systems have become paramount. With the upcoming release of the IRIS Risk Retina specifically tailored for the healthcare sector, organizations can gain a powerful tool to enhance their risk management strategies. Here, we’ll explore the significance of IRIS Risk Retina for the healthcare industry and highlight how optimizing vulnerability remediation can significantly reduce risk and fortify security measures.
The healthcare sector holds a treasure trove of sensitive information, making it an attractive target for cybercriminals. The evolving threat landscape, coupled with the increasing interconnectedness of medical devices and systems, has raised concerns regarding data breaches, ransomware attacks, and the potential disruption of critical healthcare services. Recognizing and addressing vulnerabilities promptly is crucial for maintaining patient trust, protecting sensitive data, and ensuring uninterrupted healthcare services….
The Cyentia Institute Library
At the Cyentia Institute, we take pride in delivering the latest insights and most cutting-edge research to our clients. Our research team has been hard at work crafting new original research pieces, but that’s not all we’ve been doing. We’ve also been expanding our research library to offer even more valuable resources to our clients. We invite you to explore our growing library and discover the newest additions, which cover a wide range of topics in the cybersecurity field. Whether you’re seeking in-depth analysis of current cyber threats or best practices for managing your organization’s security, you’ll find it in the Cyentia Institute Research Library!


Leave a Reply
Want to join the discussion?Feel free to contribute!