Our mission here at the Cyentia Institute has always been to raise the bar of knowledge and practice in the field of cybersecurity through data-driven research. Looking back over the years, I’m proud of the work we’ve done in pursuit of that mission. And if I had to pick one particular stream of research that epitomizes what we aim to accomplish, the Prioritization to Prediction (P2P) series on vulnerability remediation and exploitation would be at the top of my shortlist.
Kenna Security (now part of Cisco) approached us back in 2017 as one of our earliest customers. They wanted to expand their existing research on risk-based vulnerability management and thought our data science and storytelling capabilities would enhance those efforts. That analysis yielded many insights and the Kenna team decided those insights should be shared with the community. Thus, the P2P series was born.
Over the course of nine volumes, we measured aspects of vulnerability management that had never been measured before. We developed metrics and KPIs that can greatly aid organizations in fine-tuning their VM programs and managing risk. The research also spawned broader community efforts like the Exploit Prediction Scoring System (EPSS) and our first foray into commercial data feeds with the Exploit Intelligence Service. And if I’m not too bold in saying, I think the research benefitted Kenna Security in many ways as well. All that to say – the P2P series became more than “just reports.”
As time has passed, it’s become challenging to find all the published P2P volumes on the web. It makes me sad to think of current and future VM teams being unable to benefit from this research, so I thought summaries and links should live in one place. As you’ve probably guessed, that place is this post. Enjoy!


P2P Vol. 1: Analyzing Vuln Remediation Strategies
Where it all began. It proposed a theoretical model to predict which of the thousands of vulnerabilities published each month were most likely to be exploited, and thus deserving of priority remediation. We introduced two key concepts of coverage and efficiency for measuring the effectiveness of your VM program:
- Coverage measures the completeness of remediation efforts. What percentage of high-risk vulnerabilities were actually remediated?
- Efficiency measures the precision of remediation efforts. What percentage of vulnerabilities remediated were actually high-risk?
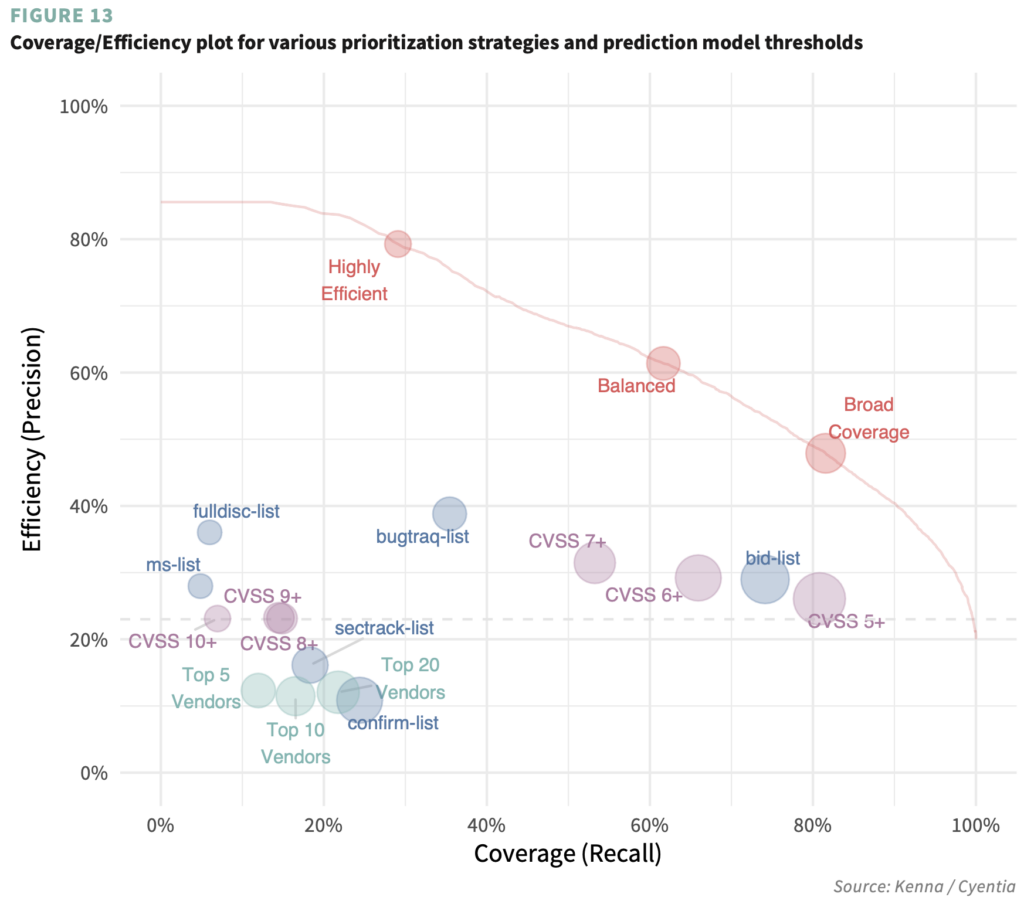
The penultimate chart in that report (shown below) demonstrated the power of that model. Compared to fixing all vulns with a CVSS score of 7+, our model achieved twice the efficiency (61% vs 31%) at half the effort (19K vs 37K CVEs) & 1/3 false positives (7K vs 25K CVEs) with better coverage (62% vs 53%). This set in motion additional research that would evolve into EPSS.
P2P Vol. 2: Getting Real About Remediation
Volume 2 sought to apply and test the model proposed in the first report in the real world using data extracted from hundreds of production environments inundated with billions of vulnerabilities. Some questions we sought to answer in P2P Vol 2:
- What proportion of vulnerabilities are observed and open across 500+ organizations and 3+ billion assets?
- How comprehensive and efficient are organizational vulnerability remediation practices in reality?
- How long does it take to remediate vulnerabilities across the network? Does time-to-remediate differ among firms?
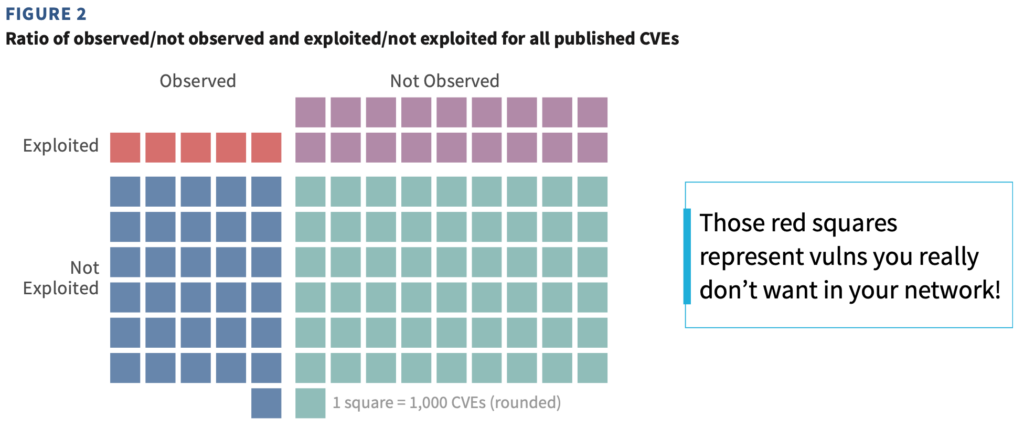
If you want answers to those questions, grab the full report linked below. The chart I chose to represent this one separates vulns that were/weren’t observed in a live environment (vertically) and vulns that were/weren’t known to be exploited (horizontally). The point was to demonstrate that a small subset of vulns (the upper-left quad) affect assets in a live environment AND have been targeted for exploitation. Organizations seeking a more risk-based approach to VM should prioritize remediation for these before all others.
P2P Vol. 3: Winning the Remediation Race
Volume 2 touched on the topic of remediation speed but Volume 3 runs that into the ground. We studied remediation data from hundreds of organizations using a technique called survival analysis to measure how many vulnerabilities can be addressed within a given timeframe.
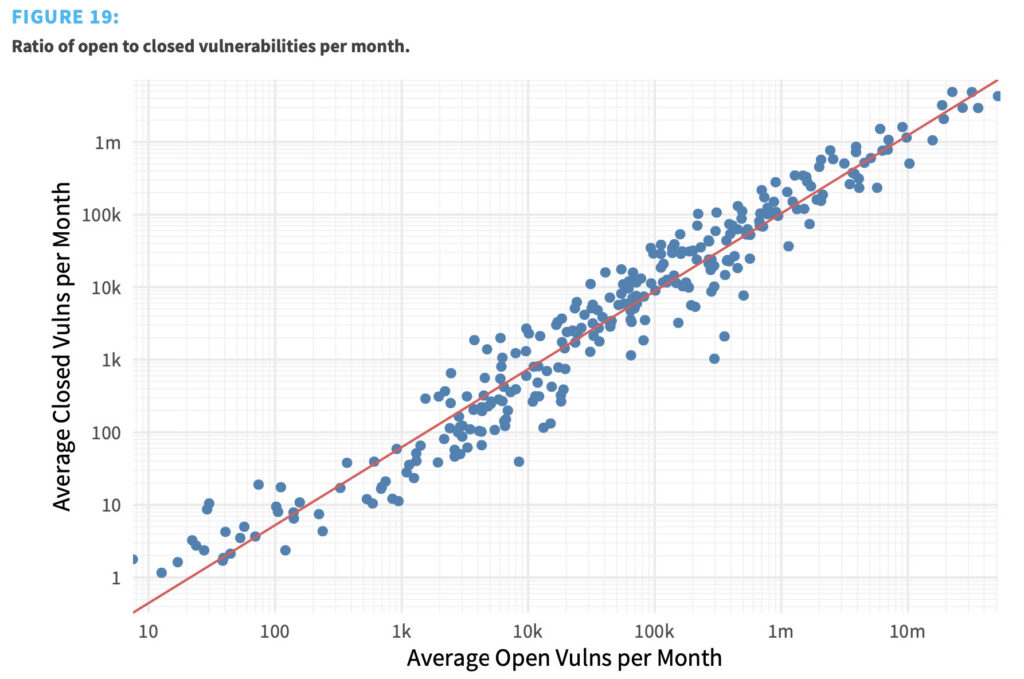
My favorite chart from that report is shown below. We tallied the average number of open vulns for each organization every month and compared that to the average number closed (each dot represents one organization). The typical organization only fixes about 10% of its vulnerabilities in any given month. And that’s consistent regardless of how many assets are in the environment. This was a big eye-opener to us and hammered home the point that prioritization was absolutely essential for effective VM. At the end of the report, we proved that it is possible to drive down the number of open high-risk vulnerabilities, provided firms can focus remediation on those first.
P2P Vol. 4: Measuring What Matters in Remediation
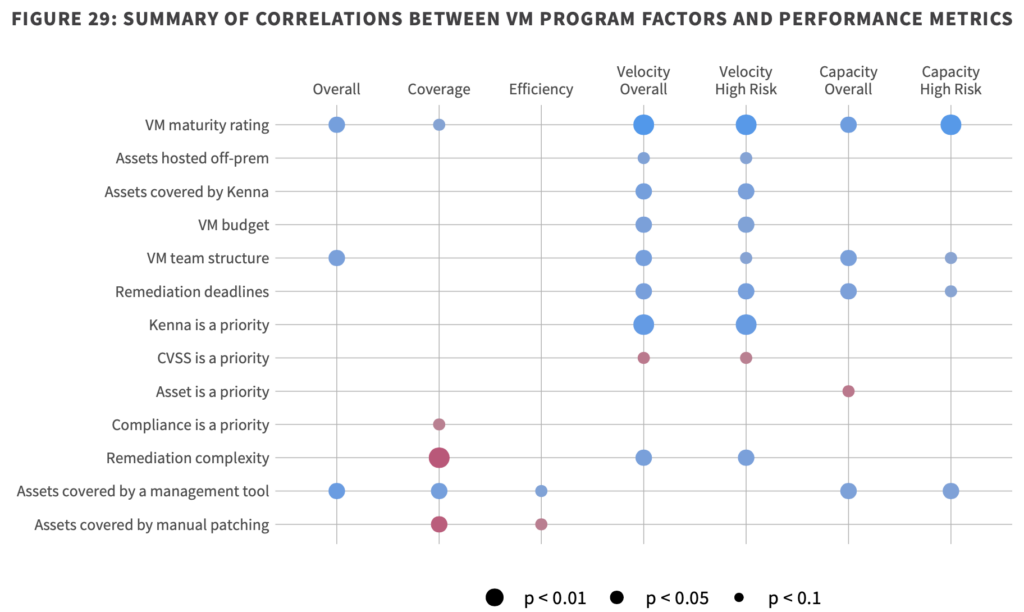
Volume 4 was different than any other in the P2P series and also unique (at that point) among all of our research. We combined survey and observational data to test how internal VM program factors affect actual remediation performance measures. This combo of “soft” and “hard” analysis uncovered some interesting correlations – some expected, some not so much.
This chart pulls it all together. The program factors we surveyed organizations about appear on the left. The objective performance measures run across the top. Dots indicate statistically significant correlations between each pair of variables (bigger dots mean a stronger relationship). Blue doets mean the factor has a positive or beneficial correlation with the associated metric, while red signals negative effects. My personal faves are the negatives:
- complexity and coverage are enemies
- the “V” is CVSS does not stand for “velocity”
P2P Vol. 5: In Search of Assets at Risk
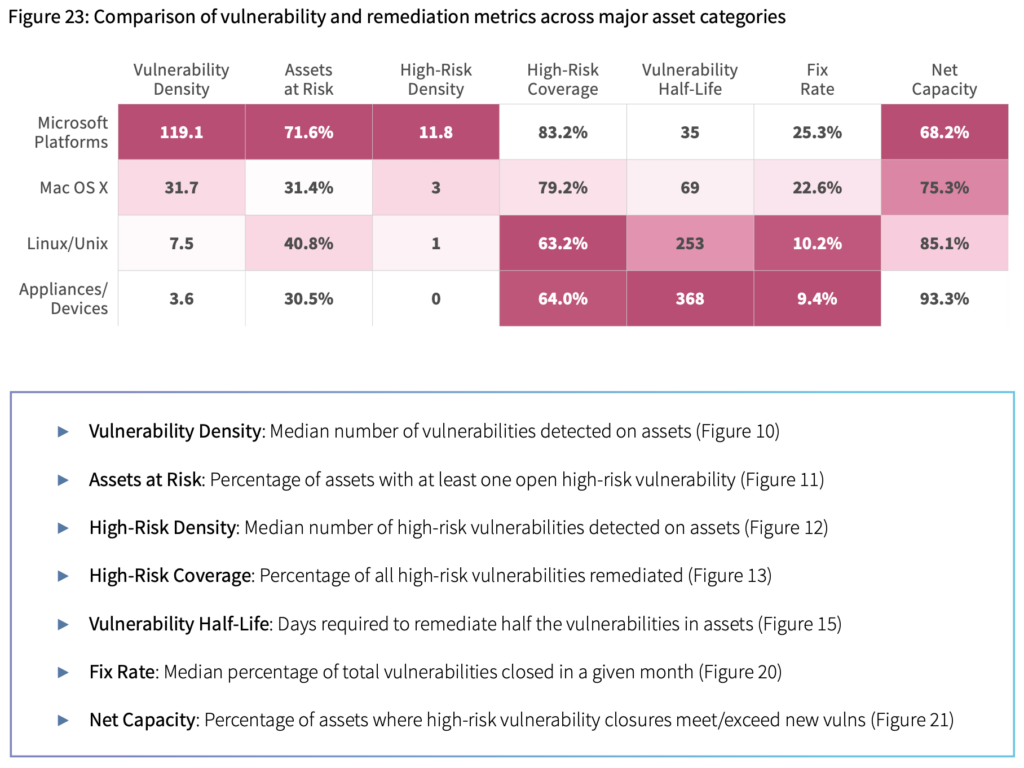
Thus far in the Prediction to Prioritization (P2P) series, we’ve taken a vulnerability-centric view of remediation. That was necessary to properly cover all the bases. But experience and customer feedback suggest that vulnerability management is often asset-centric (or at least asset-influenced). Because of this, we looked at the vulnerability risk landscape through the lens of common asset platforms in the fifth volume of the P2P series. We revisit classic P2P metrics like coverage and capacity but also derive some new measures unique to assets to help VM programs stay on target.
The “grand finale” viz in that report compares those metrics among four broad asset categories. The point is to demonstrate that remediation performance is inherently affected by assets under management. For example, An environment filled with Windows servers and desktops will open a ton of doors for potential exploitation but also enable those doors to be closed very quickly. The point is that understanding the inherent strengths and weaknesses of different platforms in use will greatly help set strategies that leverage those strengths and compensate for weaknesses so the VM program is better able to succeed in its vital mission.
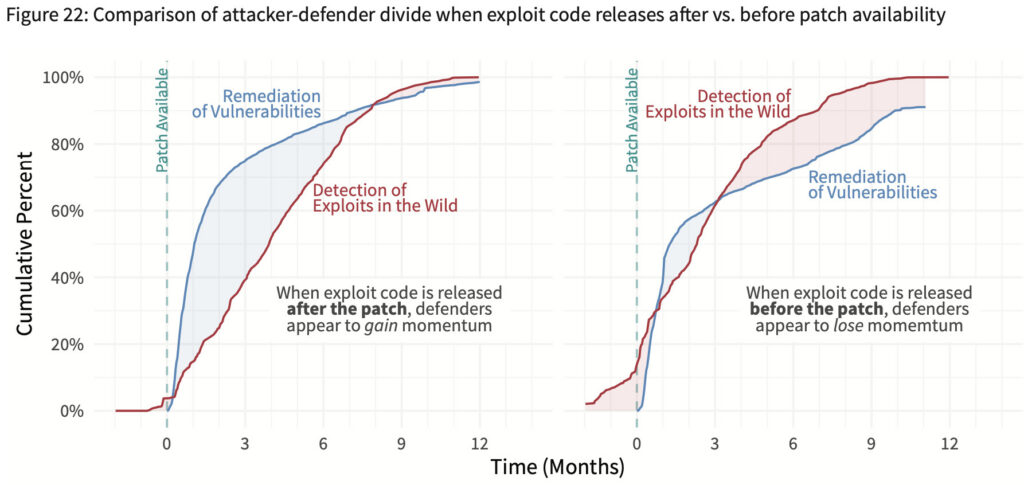
P2P Vol. 6: The Attacker-Defender Divide
If you’ve ever wanted to know the time from x to y in the vulnerability lifecycle, Volume 6 is your jam. We study about 500 vulnerabilities as they’re discovered and disclosed, patches are created, exploit code drops, defenders begin remediation, attackers begin exploitation, etc and measure the time between each of these milestones.
We end the report focusing on the timing of patch availability relative to proof-of-concept (PoC) / exploit code release. The left side of the chart below shows the normal/ideal progression of patch before PoC. The right chart offers the PoC-before-patch corollary. The difference is unmistakable. The period of defender momentum is drastically reduced when an exploit is released before the patch becomes available. Moreover, attackers control the momentum for a much longer period of time. This obviously raises some very important—and rather uncomfortable—questions about vulnerability disclosure, remediation, and exploitation.
P2P Vol. 7: Establishing Defender Advantage
Coming out of Volume 6, we had two questions in view of Volume 7:
- Does releasing exploits before patches are available help or harm defenders?
- Which software products offer the greatest degree of advantage to defenders?
Many have opinion on those questions, but we’ve never been all that interested in opinions for this report—including our own. We’re interested in gathering hard evidence, formally testing hypotheses, and reaching well-justified conclusions. Which is what we did by formally stating hypotheses for question 1 and testing them scientifically. I’ll let you read the report to learn what those tests revealed.
The chart below focuses on the second question and shows the same timelines compared in Volume 6 for remediation (blue) and exploitation (red). We also derive a single value capturing the relative degree of attacker- defender advantage exhibited by each vendor. Calculating that gets rather complicated, but the short story is that the value is the difference between the areas under each curve. So, if you see a blue positive number in the upper-left corner, it indicates some degree of defender advantage. A negative red number means attackers have the upper hand for that product set (rate of exploitation exceeds remediation).
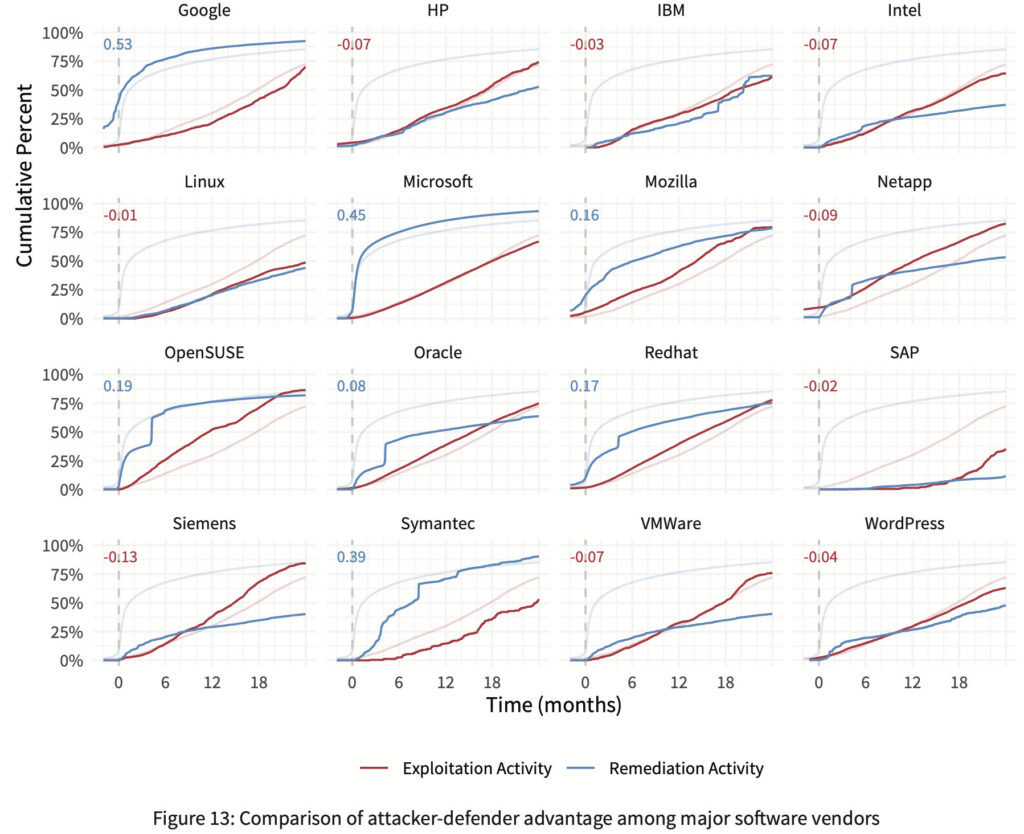
From this, it’s obvious that some software vendors/products are more conducive to maintaining defender advantage than others. If that point seems very important for VM programs to you, we agree. But this is a summary, so we have to move on…
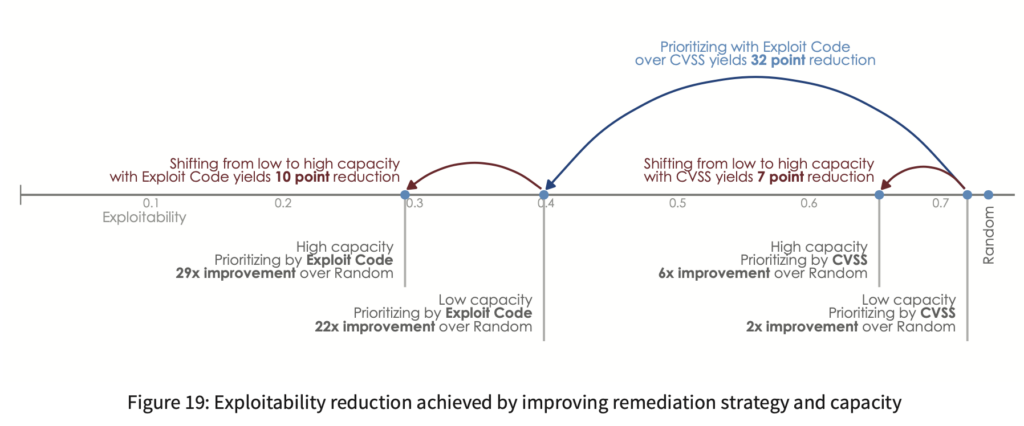
P2P Vol. 8: Measuring & Minimizing Exploitability
A closing question in Volume 7 teed up our goal for Volume 8: “Is it possible to determine the relative exploitability or remediability of an entire organization?”
To answer that, we first explore ways to measure exploitability for individual vulnerabilities—and far more importantly—entire organizations. Second, we create a simulation that seeks to minimize organizational exploitability under varying scenarios combining vulnerability prioritization strategies and remediation capacity. Bottom line: If you’re looking for proven ways to squeeze the most risk reduction from your vulnerability management (VM) efforts, this report is for you.
The chart below shows the results of that simulation. Compared to randomly fixing vulnerabilities as they pop up, low capacity with a poor strategy (CVSS) cuts your vulnerable attack surface in half. Sticking with CVSS and increasing remediation capacity from low to high triples that reduction to 6X. Alternatively, keeping capacity low while switching to a better strategy of prioritizing exploited vulnerabilities drops exploitability by 22X. So, if you have to make a choice, better prioritization can leapfrog capacity constraints to minimize risk for your organization.
But doing both is even better. An organization combining a good vulnerability prioritization strategy (Exploit Code) with high remediation capacity can achieve a 29X reduction in exploitability! This hammers home the message that vulnerability management is not a mindless, endless loop of finding and fixing. Organizations have a great deal of control over their attack surface through the strategies and capabilities they employ.
P2P Vol. 9: Role of the KEV in risk-based vulnerability management
Around the time we were finishing up Volume 8, the Cybersecurity and Infrastructure Security Agency (CISA) released the Known Exploited Vulnerabilities (KEV) catalog. It’s a list of vulnerabilities known to be the target of exploitation activity. The KEV has since garnered a lot of attention in the VM community, and we thought it deserved analysis to understand it’s role in RBVM.
This latest installment of P2P explores the KEV and gives some context to what it means (and doesn’t mean) for other organizations. Moreover, we demonstrate how the KEV can fit into any risk-based vulnerability management program. In fact, here are some key findings, but you’ll really want to read the whole report to get the good stuff.
P2P Volume 9 is out now! Download Here