An Inside Perspective on Security Operations
 We are thrilled to announce the culmination of a project we’ve been working on for some time. The Voice of the Analyst Study released today and we’d like to share a few findings with the hope of stoking your interest enough to read the full report.
First off, our thanks to Respond Software for commissioning this research. We love doing worthwhile research, but couldn’t do it without partners like Respond. When they approached us with the idea for this study, we recognized immediately it was a great opportunity to present a unique and valuable perspective on security operations.
Second, thanks to all those who volunteered their time to share their perspectives and experiences. That includes the individual analysts as well as the enterprise and MSSP SOC teams that participated. They are the “voices” behind this study, and we hope the final product lets them be heard.
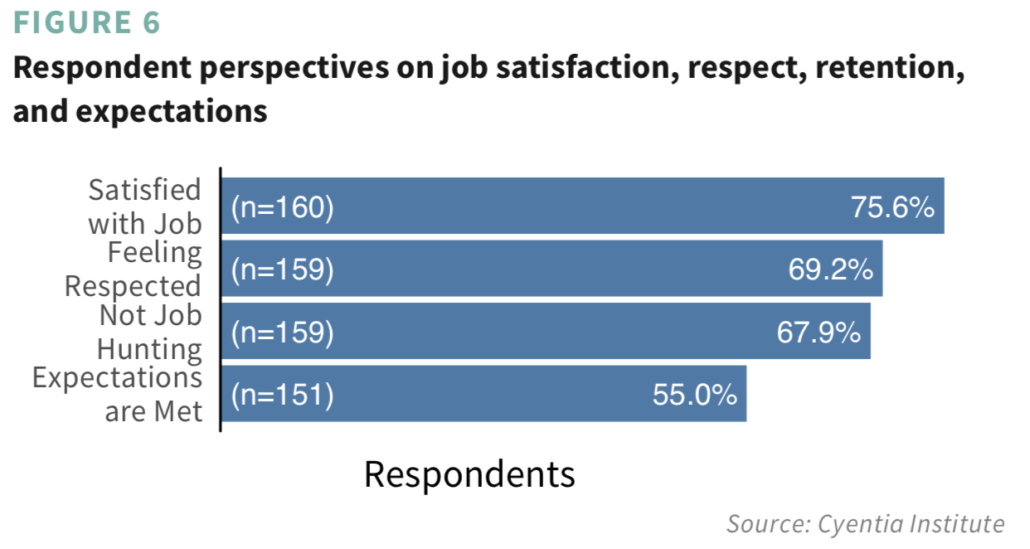
Beyond demographics, the first major section of the report covers several questions we asked to gauge analyst attitudes and perspectives. As you can see from the figure below, we found more positive than negative sentiment overall. Though there are some factors that alter that balance, and we discuss those in the report.
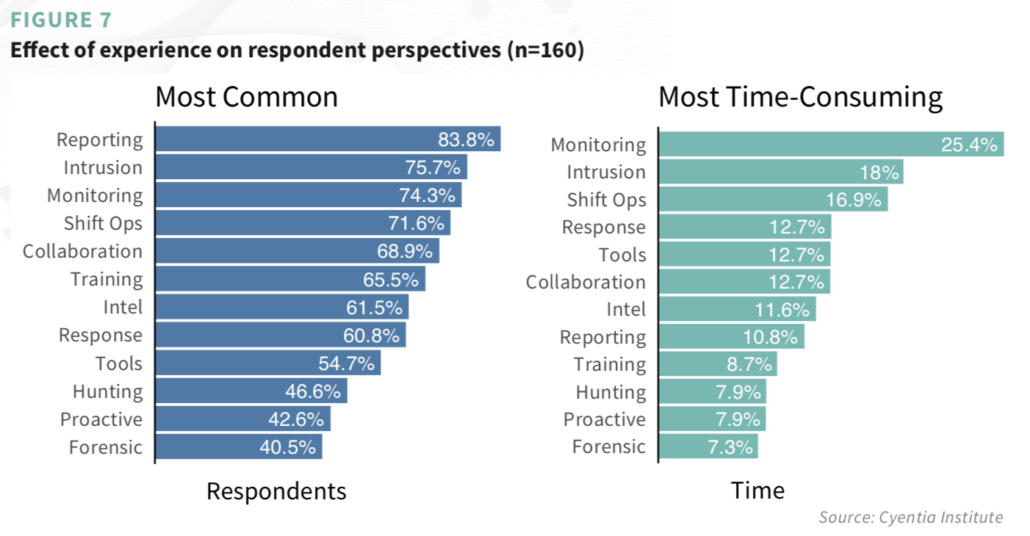
After studying how analysts view their work, we wanted to better understand how analysts do their work. We identified 12 common SOC/CIRT activities and asked what percentage of their work week was spent on each activity (definitions for activity labels are given in the report). Aside from know which activities were the most common and most time-consuming (see figure below), we also were able to distinguish generalists from those will more narrow responsibilities.
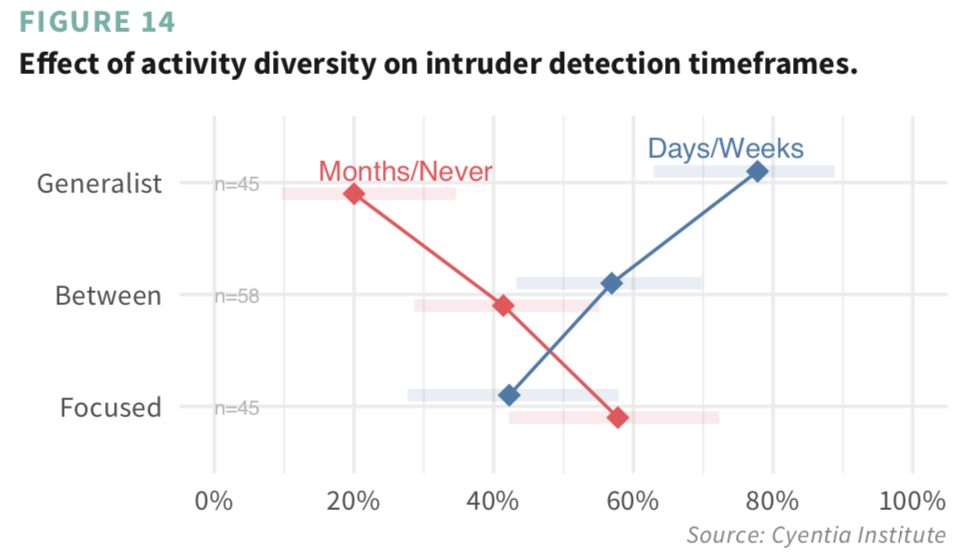
The generalist vs focused distinction turned out to be pretty interesting because it looks to have a significant effect on detecting and responding to intrusions. The figure below, for instance, shows generalists are twice as likely to claim recent detections compared to staff with more narrow responsibilities. We think that’s a pretty important finding and speculate what’s behind it in the report.
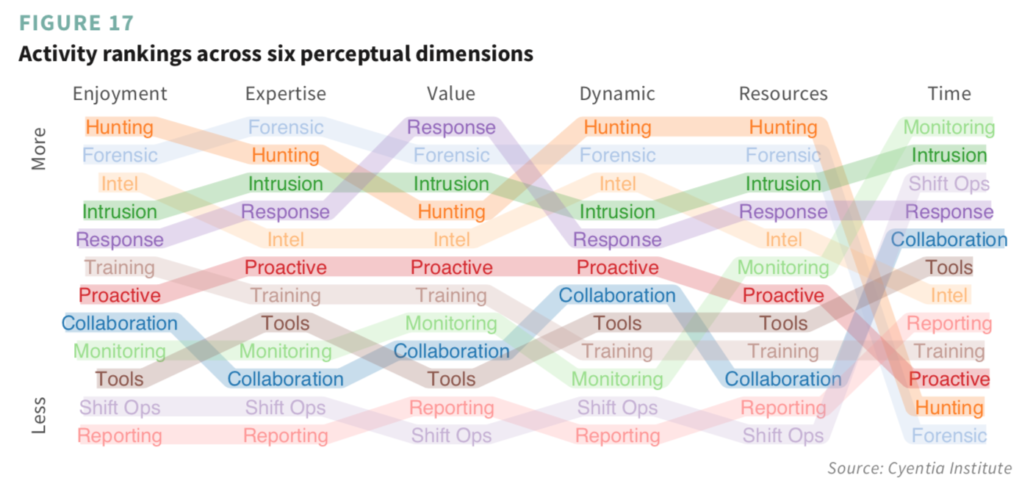
We also asked analysts to rate activities along several dimensions. Each column in the figure below ranks the 12 activities in descending order, according to the six dimensions. The colored bands worming their way across the figure help keep the activity perspective intact. For instance, monitoring slithers around at the bottom of the list, but climbs upward through the resources and time dimensions. This indicates respondents’ view of that activity as fairly resource intensive and very time-consuming. On the other hand, response and forensics seem to provide excellent value compared to the resources and time invested.
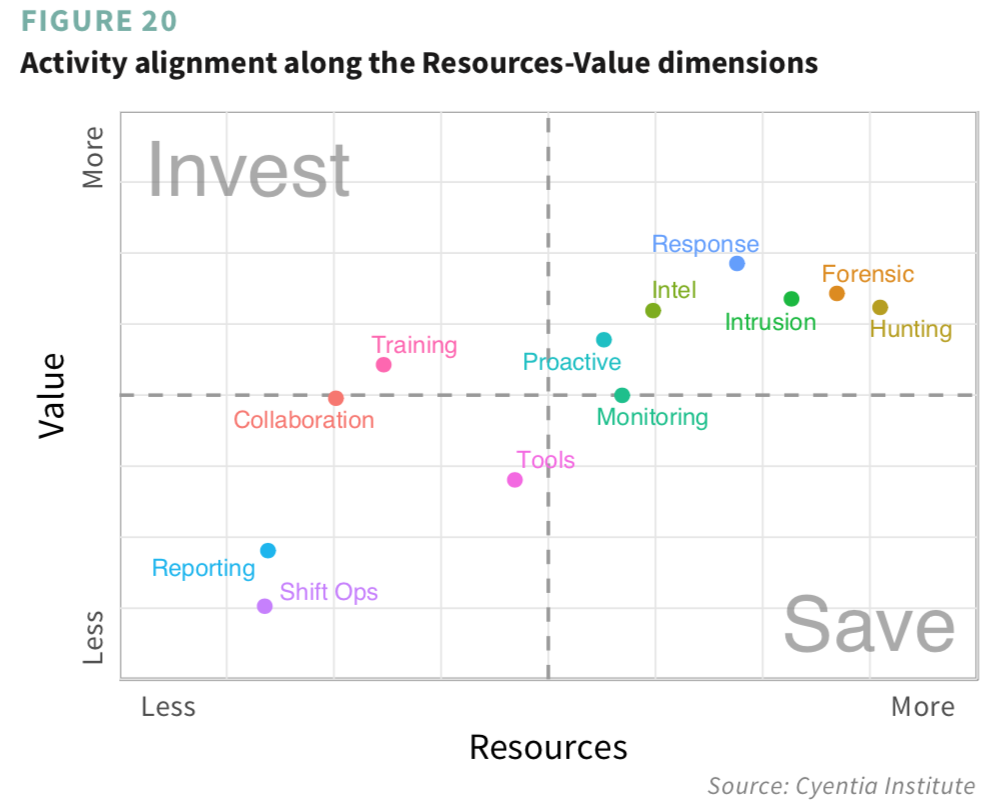
Speaking of providing excellent value for resources invested, that’s something else we dug into using the dimensional ratings. In theory, activities in the upper-left of Figure 20 would offer good value at comparatively low cost. The two fitting that bill are training and collaboration. We see no activities in the lower-right ‘No Man’s Zone’ of Figure 20, but monitoring strays dangerously close to that line. Our takeaway is that it pays to invest in your people; help them be the best they can be individually and collectively.
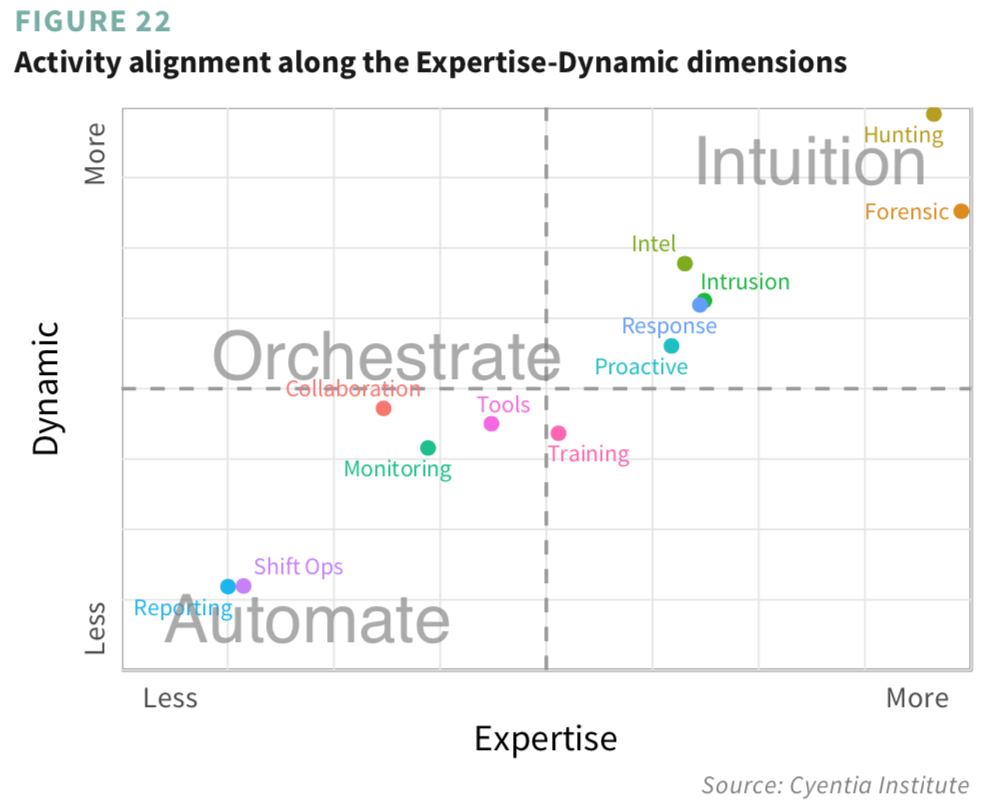
One more and then we’ll close this out and let you get to reading the full report. There’s a lot of buzz in the cybersecurity industry of late around artificial intelligence (AI), automation, and orchestration. As is our way, we wanted to cast some data-driven signal into that noise. We essentially want to distinguish between higher-order activities that require humans in the mix and the lower-level ones that can be adequately handled by machines. What’s our interpretation of the results shown in Figure 22 below? Grab the full report to find out and let us know if you agree.