As my colleague Ben recently pointed out, in our latest collaboration with Veracode on the State of Software Security Volume 10, we analyzed more than 85,000 applications to try to better understand application security. We sliced things every which way:
- What percentage of security flaws are fixed?
- How long does it take to fix the typical flaw? And what do we mean by “typical”?
- What contributes to the accumulation of security debt?
- How do these things vary by: scans per year, language, flaw type, severity, exploitability, industry and even geographic region?
I’m going to tackle that second question, “How long does it take to fix the typical flaw?” This may seem straightforward at first. Take a flaw, note when we first saw it, note when it was fixed and calculate the difference in our favorite unit of time. If we want to know about typical, maybe we just take an average. How hard can it be? It turns out to be quite a bit more complex than that.
Before we jump into any of the application security data, let’s talk about why we’d want to measure this. First, everybody wants to know how they are doing and if they should be doing better. Comparing yourself to peers can give you a sense of how you are doing since it can establish what’s possible and what’s likely. Second, we want to track this over time and keep an eye out for shifts that may be caused by new development practices, philosophies and/or any other solutions.
What do we mean by “typical”?
It’s often helpful to reduce a collection of measurements into a single number that represents “typical” and usually this is done by using either the arithmetic mean or the median. The mean is calculated by adding up all the measurements and then dividing by the number of measurements, while the median is the “middle” value so exactly half of the observations are above and half are below the median. Now if we have a collection of observations that are symmetric, like the classic bell curve, the mean and median are generally the same value. “Average” here isn’t dependant on which calculation you do since they are basically the same. But if we have any skew or long-tail, the median and the mean can diverge dramatically. That’s because the mean can be heavily influenced by extreme values and outliers.
A Focus on “Closed” Flaws
A (very) simple approach to measuring how long it takes to fix a flaw, is to simply look at the flaws that have been fixed and calculate “typical”. This is intuitive and relatively easy to do. From what I can tell, publications are using this approach to report on how long it takes to fix flaws, so if we want to compare across different studies it is a good idea to talk about this approach.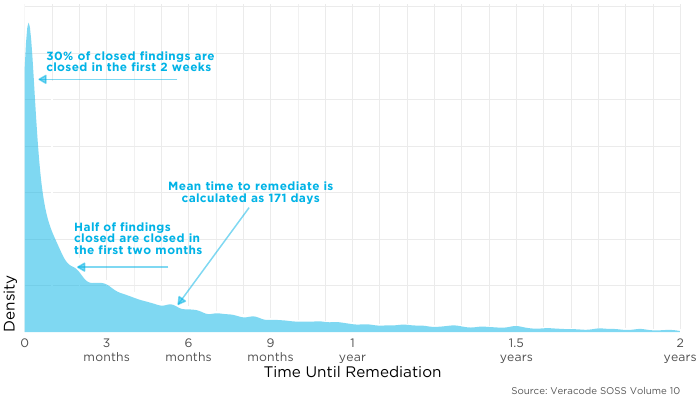 Just take a moment and take in that density plot above, notice first that there is a lot of activity right after a flaw is discovered, but that drops off and then we see a very long tail going out at least two years (I cut off the visual at two years). Notice about 30% of flaws are closed in the first 2 weeks, at that rate, we’d expect everything to be closed within 2 months. However, remediation efforts slows down and we see that half of the findings are closed in the first 2 months (59 days to be precise). That point is the median (again, half are closed before and half are closed after). Because of the long tail, when we calculate the mean on these closed findings it is much longer than the median coming in just before the 6 month mark because the long durations out on the tail pull up the mean away from the median.
A Focus on All Flaws
Just focusing on the closed flaws doesn’t tell us the whole picture about application security.
Imagine we want to test how long light bulbs last (this will get tied back to application security, I promise). We plug in 100 light bulbs and check on them daily for three months. In that time only a handful have failed, and then someone asks “how long do these light bulbs last?” We still have the majority of lightbulbs still working, would it make sense to take the average of those that have failed and report on it? Not if we want to understand something about the light bulb because it ignores the ones that haven’t failed yet. That’s exactly what the annotations on the above plot are doing. They assume the “still open” flaws either don’t matter, or they will mimic that same pattern. Let’s take a look at what those look like: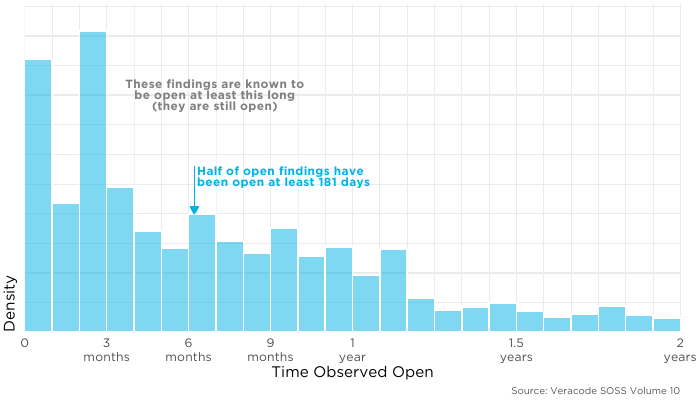
The distribution of open flaws does not look like the one above just showing closed flaws, so we can rule out the second assumption (that open flaws mimic closed). If we closed all of the open flaws right now, it would dramatically shift our estimation of the “typical” duration before fixing. The median here is 181 days, a far cry from the 59 days for the closed findings. So by talking about just the closed findings we are ignoring these open ones.
Even though we don’t know when a flaw will be fixed because it’s still open, we do know one thing: we know that it’s been open at least as long as we observe. That is, if a flaw has been around for 6 months, we know for certain that it hasn’t been fixed in the first 6 months. So we can leverage that and create what’s known as a survival curve (or a Kaplan-Meier curve):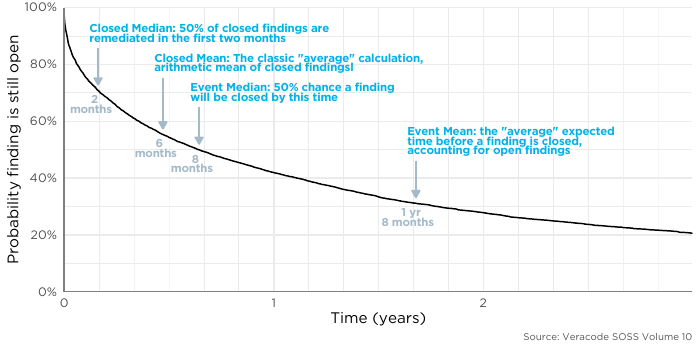 I included references to the median and mean from just the closed flaws as a reference point on the curve. Think of the curve like this: Once a flaw is discovered in an application, what is the chance it will still be open after some period of time? The truth is, many flaws (and thankfully the minority), are for whatever reason, just not closed. So taking this application-centric view shows a very different story. Remember if we just focus on the closed flaws, we’d say the median close time is 59 days but if we look at all of the findings, the median closure rate is actually just under 8 months. So there are two ways to state this:
- Developers closed half of their flaws in the first two months.
- Half of the flaws in an application are closed in the first eight months.
Notice the difference? The difference is in the framing. Do we want to focus on the “typical” being just closed flaws by developers or is “typical” looking at all flaws in an application? By focusing on just the closed flaws, we are looking at when most activity by developers will occur, and half of the flaws are addressed in the first two months. But by looking at all flaws including those still open we take an application-centric view. Out of all the flaws in the application, half of the flaws are addressed in the first eight months.
Unfortunately, there isn’t a clean, simple and single answer here, there is no single right answer on what “typical” represents. It depends on which view you’d like to take and what you’re trying to decide. In our case, to compare to other research in the field and to get a feel for the activity of developers, we need to talk about about the first approach (just closed flaws). But to really get at the state of software security, we need to keep an eye on the big picture here, and accounting for all the open flaws as well as the closed gives us a good picture of what’s going on within application security.