Bottom line up front: The Security Outcomes Study – our first collaboration with Cisco – just hit the shelves. We surveyed over 4,800 IT and security professionals to measure the increase in probability of (reported) success along several security program outcomes associated with strong (reported) adherence to various security practices. In other words, what actually works in security? Download the report (no registration required!!) here.

I’ve been doing survey-based security research for quite some time now. The first ones I recall being involved with were conducted in the aftermath of SQL Slammer, MS Blaster, and MyDoom, and other Internet worms of that era (circa 2003-2004). Invitations to those were sent to a large mailing list of security professionals, and we got decent response to them. Pretty much every survey I’ve seen since then has been some form of “The invites will continue until response numbers improve.”
Now, I’m not saying all such surveys are worthless and we can’t learn anything from them. We’ve done several survey-based studies here at the Cyentia Institute, and we’ve tried hard to conduct them in accordance with sound sampling principles. But doing surveys right is really, really hard. Which is why most of them are done wrong and why we generally shy away from them at Cyentia. If we can’t do it well, we’d prefer not to do it at all. Looking over survey research from the industry that we curate in the Cyentia Library, I kinda wish others made that same decision more often :-/
But I’m happy to report that I’ve finally witnessed what proper sampling looks like in a security survey. I’m also happy to admit that we didn’t field it. Earlier this year, Cisco brought us into the planning process for what used to be called the CISO Benchmark Report. During the ideation phase with the excellent team there, we quickly agreed that we wanted to focus on key success factors that drive security program outcomes, and thus the Security Outcomes Study was born.
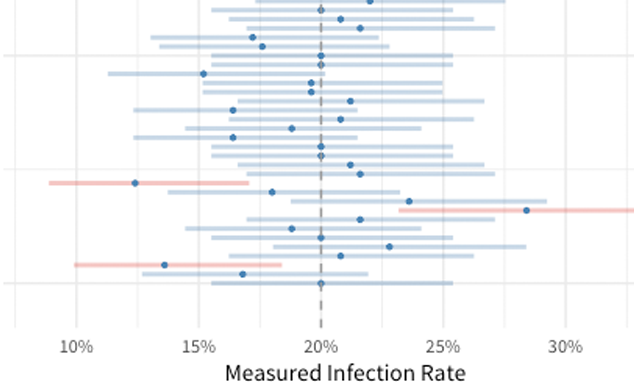
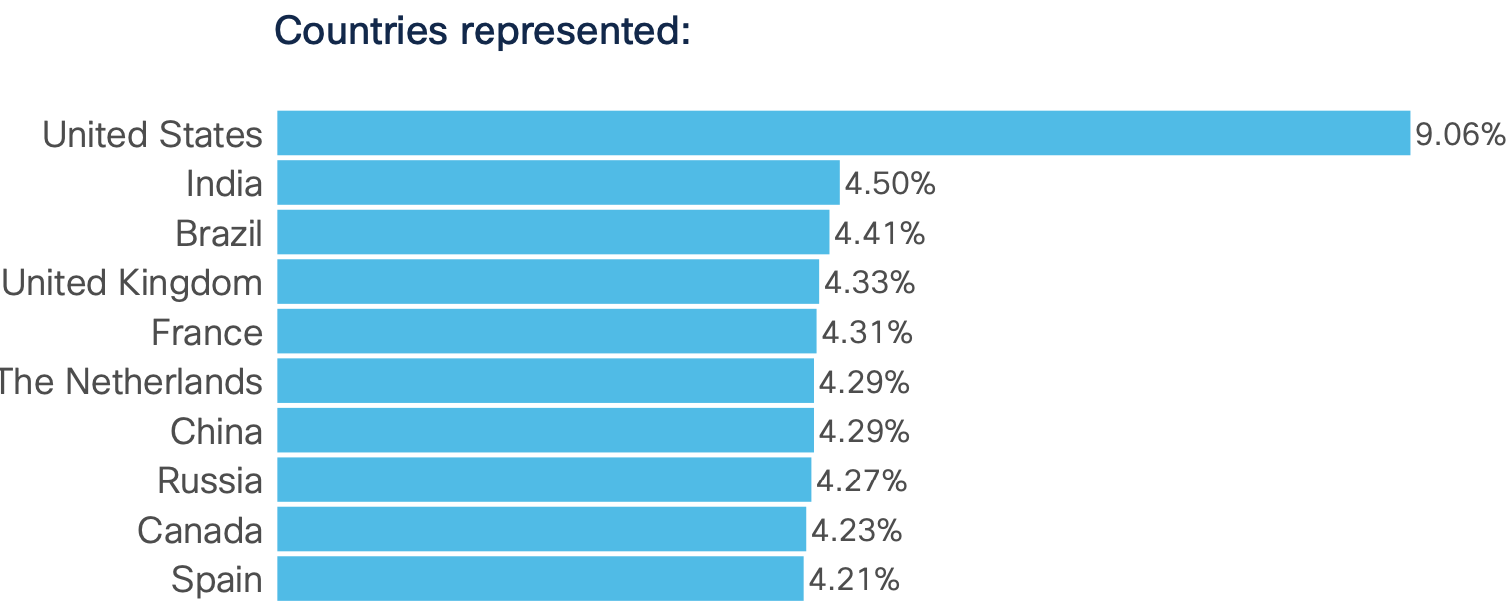
Because there’s no way we could field a global survey to meet their criteria, Cisco contracted a legit third-party survey research firm. They set up and conducted a double-blind, stratified random sample with a response quota for 25 countries. What does that look like and how can you as a reader discern whether a given report used proper sampling? Take a look at this figure from the report tallying responses by country:
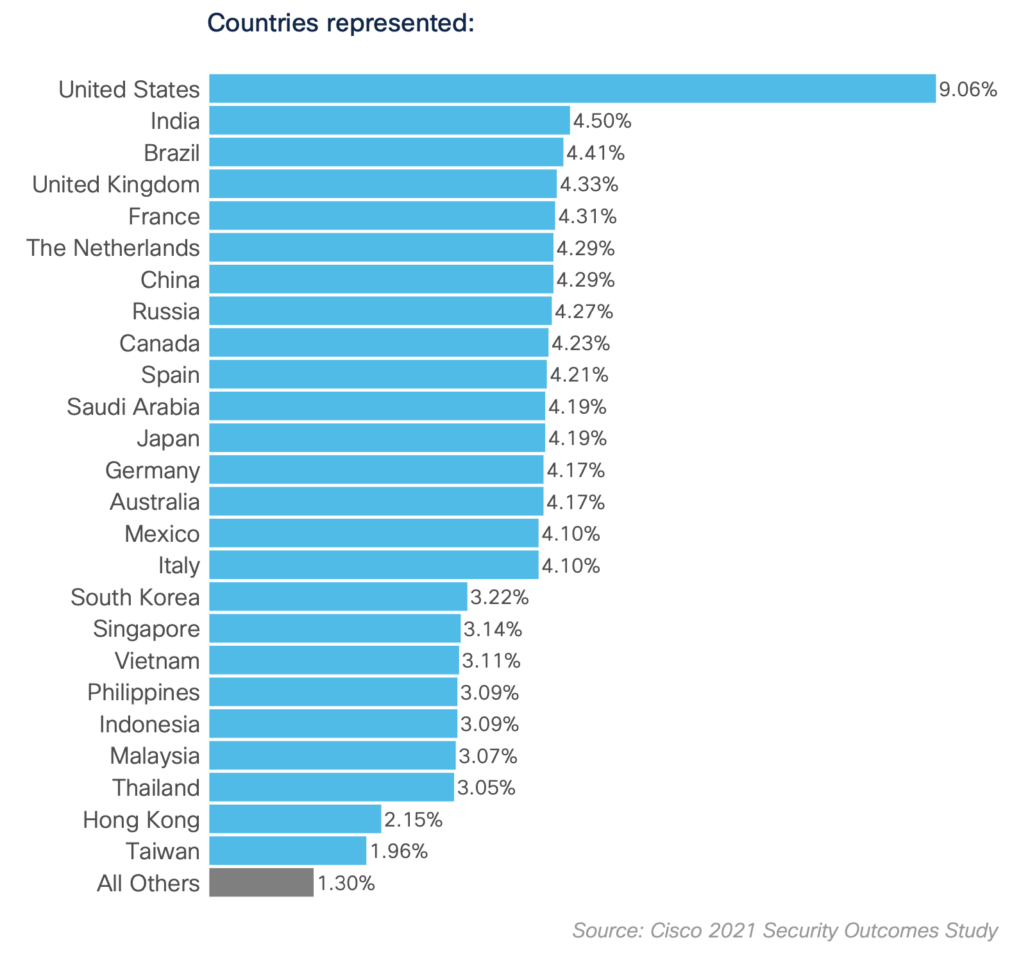
The telltale sign of a well-sampled survey (at least for a quota stratified sample like this) is proportionality across the strata (countries in this case). Cisco essentially said “We want approximately 400 responses from the US, 200 from India…Itally, 150 from South Korea…Thailand, etc. Without those established quota, there’s no way a geographic breakdown of responses looks like it does in that figure. I know it’s never looked like that in any survey I’ve ever been a part of.
And because the sampling was done like that, we were able to compare results at the country level while maintaining an adequate number of responses. Again, not something we generally have the ability to do outside the US and maybe a few of the big EU countries because of dwindling representation of responses. I would have loved to see some stats on response rates in each country, but beggars can’t be choosers, I suppose.
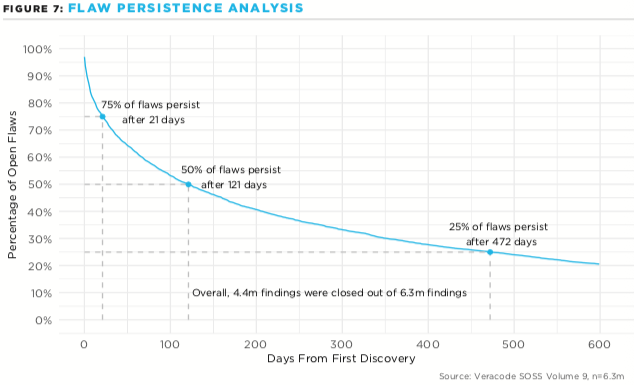
If you’d like to experience to joy of segmenting results by your country of interest, you can do exactly that on the landing page for the study. Scroll down to the bottom, and you’ll see a chart that looks like the ones shown below. Clicking the menu in the bottom left allows you to alter the chart to depict stats for that particular country. I selected one country for each of the three main regions to include as examples below, and it’s obvious the findings differ substantially among them.
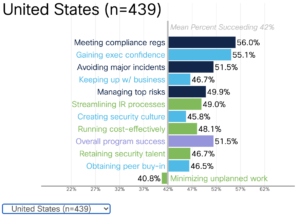
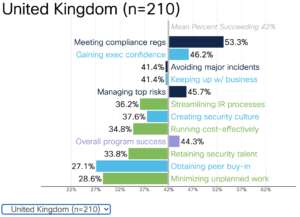
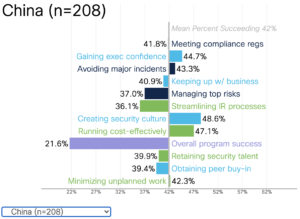
The charts above compare how organizations in different countries are successfully achieving each respective security outcome. See the interactive dataviz to view results for other 20+ additional countries/regions.
I’m not going to get into the findings of the report in this post, but Ben will dive into that and the methods used soon. I mainly wanted to give public kudos to Cisco for caring enough to do it right (it ain’t cheap) and for giving me a chance to finally see what legit survey data looks like. See it for yourself in the 2021 Security Outcomes Study.