For two decades, I’ve heard security professionals urging organizations to “just patch your stuff” as though they don’t already know that and/or it’s as simple as saying those words. This is where real data and “thought leaders” differ. The data acknowledges that things aren’t so simple in the real world because vulnerability remediation is a moving target (new vulns are found as old ones are fixed).
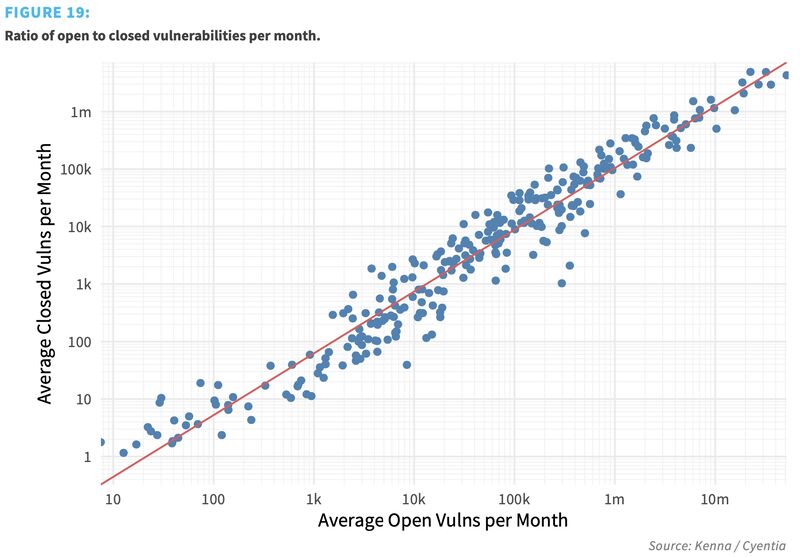
We measured the remediation capacity of hundreds of organizations over a 12-month period. To do this, we calculated the total number of open (unremediated) vulnerabilities in the environment and the total number closed each month. We then averaged that over the active timeframe to get a monthly open-to-closed ratio for each organization and created a log-log regression model. The results are recorded in the figure below, where each organization is plotted along the grid. And those results are INSANE!
The R2 statistic for this log-log regression model is 0 .93, meaning that it’s very strong and captures most of the variability around vulnerability closure rates. You can see this visually in the figure because all the points—which represent the remediation capacity for each firm—fit tightly along the regression line.
Strong models are great, but there’s something else we learned that’s greater still. Notice first that each axis is presented on a log scale, increasing by multiples of 10. Now, follow the regression line from the bottom left to upper right . See how every tenfold increase in open vulnerabilities is met with a roughly tenfold increase in closed vulnerabilities?
That, in a nutshell, is why it feels like your vulnerability management program always struggles to keep up. And why “just patch it, stupid” is ignorant and unhelpful advice. A typical organization will have the capacity to remediate about one out of every 10 vulnerabilities in their environment within a given month. That seems to hold true for firms large, small, and anywhere in between.
So is there no hope? Are vulnerability management programs destined to slowly drown in a quagmire of their own making? No! We did observe organizations that managed to drive down risky vulns in their environment over time…but that’s another story for another post. Follow / stay tuned for their secret (hint: it doesn’t require buying a product).
This chart comes from Prediction to Prioritization, Volume 3 – a joint study published 4 years ago between Cyentia Institute and Kenna Security (now Cisco). You can view it for free on their website!