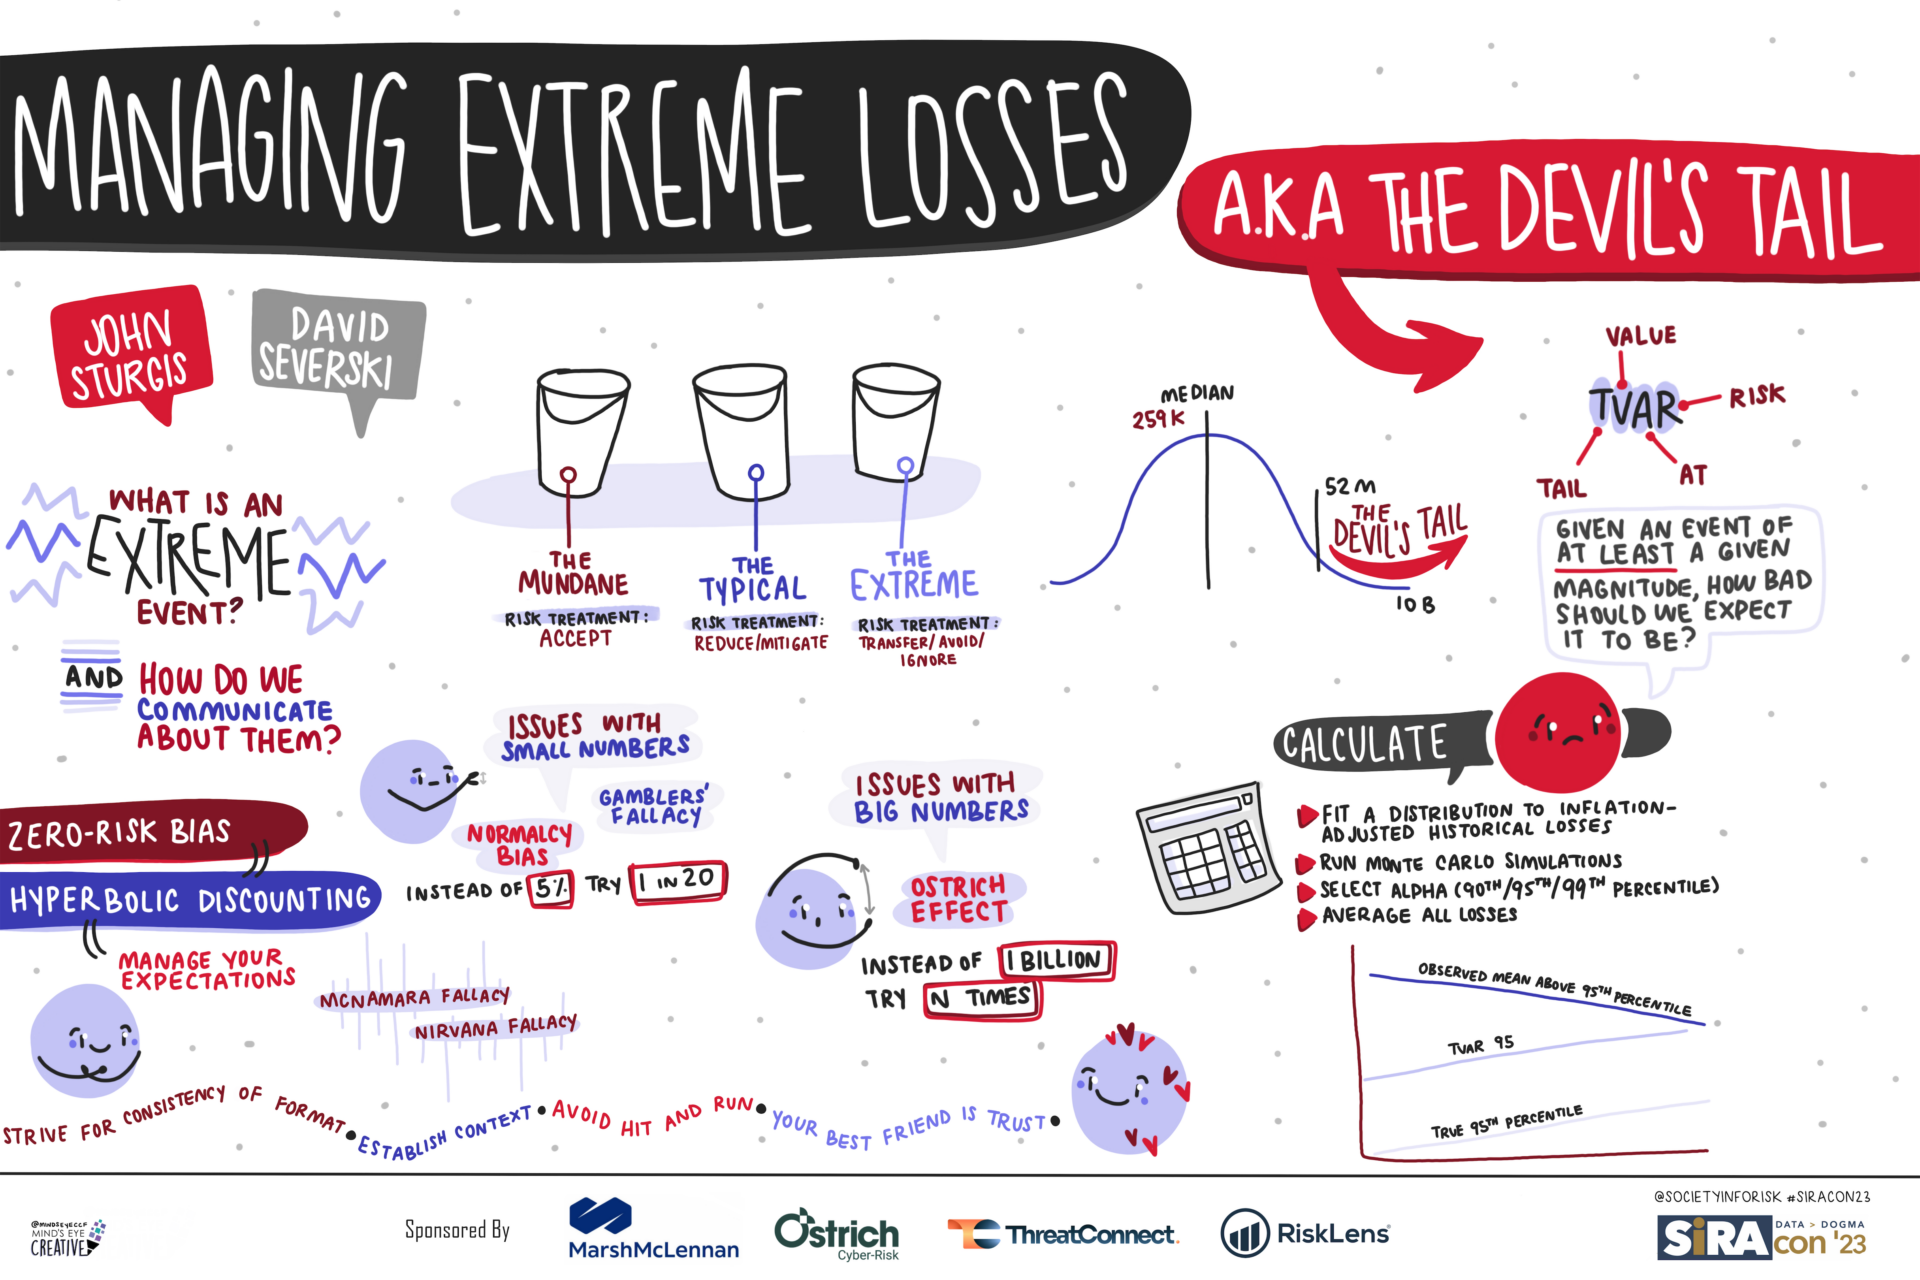
Our team just returned from SiRAcon ’23 where the conference theme was “Measuring Extremes.” If you’re unfamiliar with SiRAcon, it’s an annual event organized by the Society of Information Risk Analysts, featuring speakers and networking opportunities for information risk enthusiasts of all stripes. One of the sessions we led focused on Tail Value at Risk (TVaR) as a tool for analyzing and communicating the risk of extreme losses.
“FUD? Where we’re going, we don’t need FUD.”
If you’re unfamiliar with TVaR, here’s the short version: take a distribution fitted to historical losses, pick a threshold (say, the 95th percentile), then average the values above that threshold. It can be a useful shorthand to convey both the rarity and magnitude of extreme losses.
“I guess you guys aren’t ready for TVaR yet. But your kids are gonna love it.”
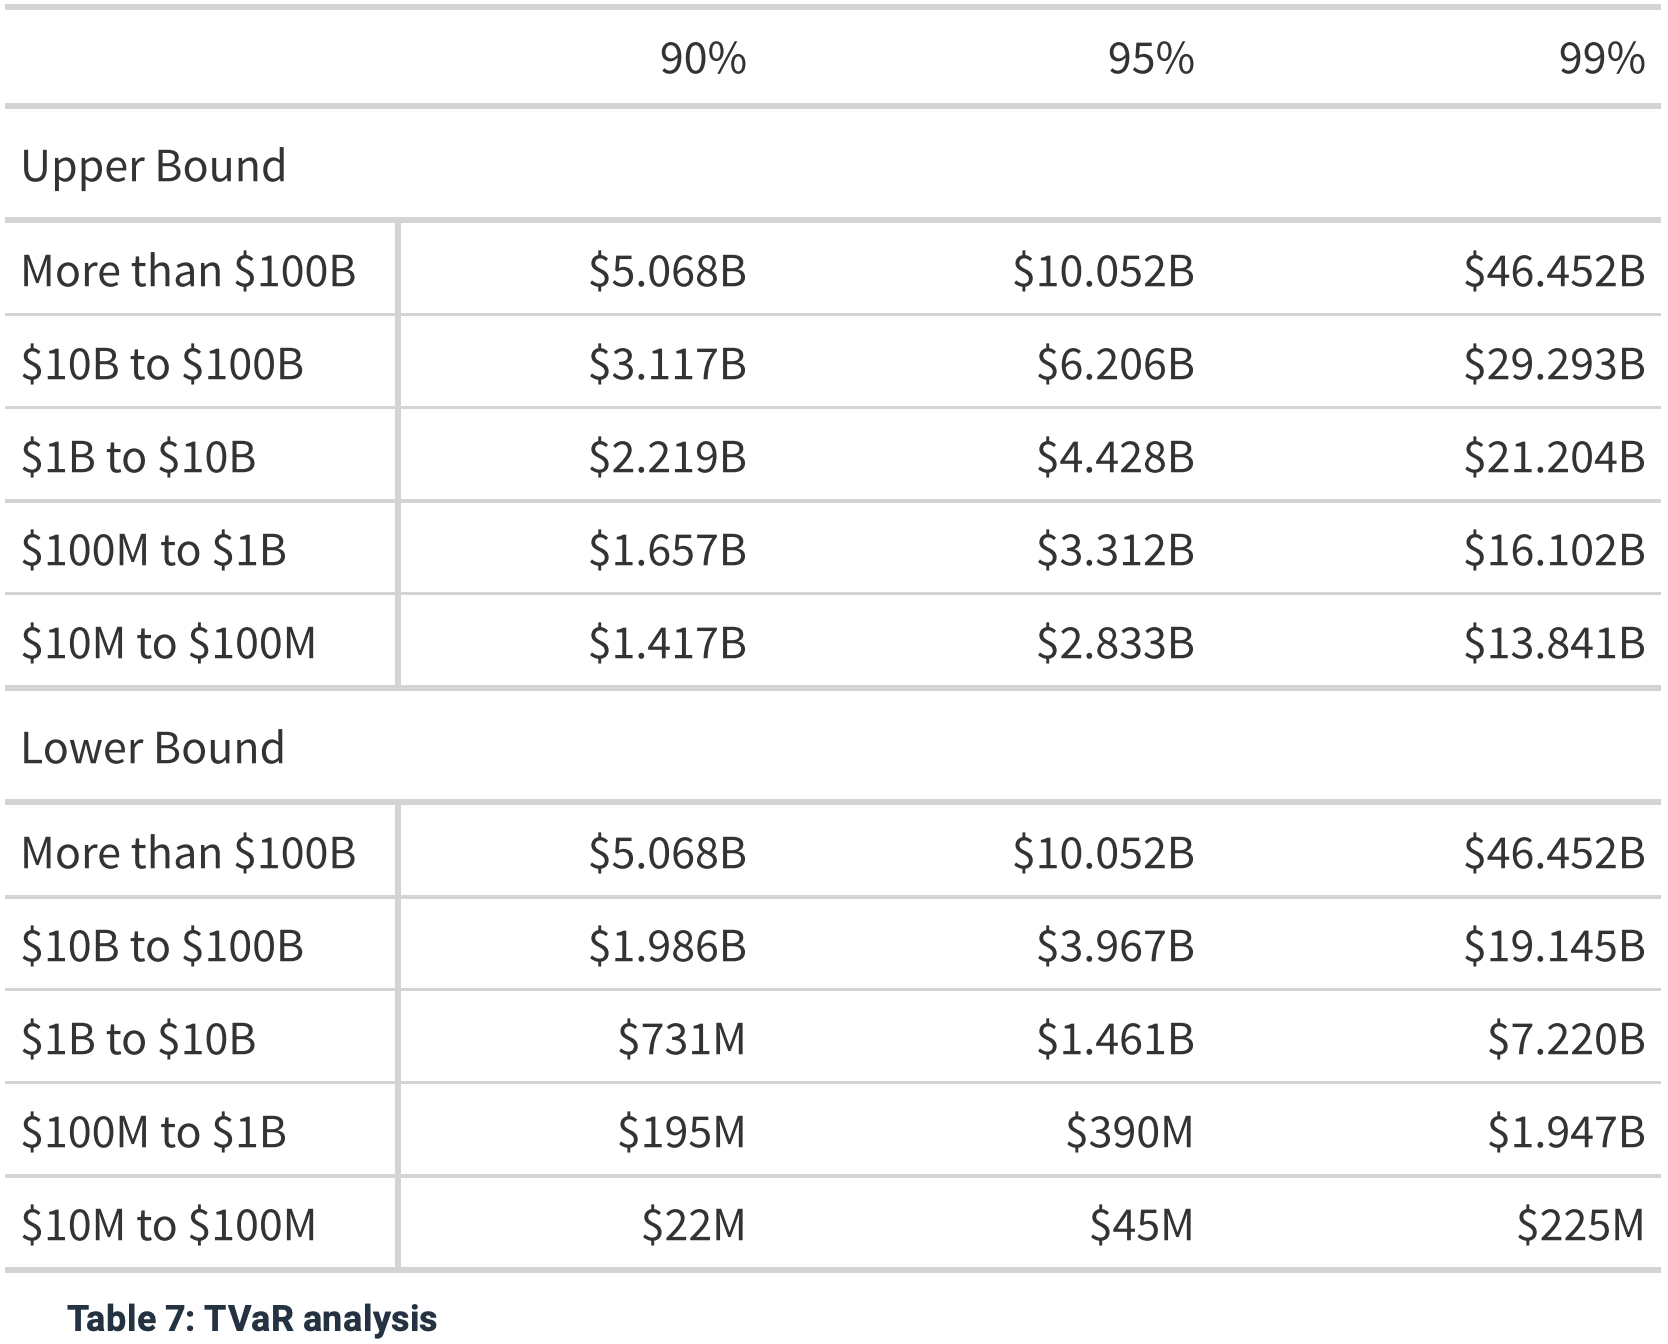
If you’ve read IRIS 2022, you may recall Table 7 which provides TVaR estimates for different thresholds across a range of revenue categories. That analysis is based on the entire dataset of cyber losses; if you’re looking for something tailored to your sector (and more!), you should definitely check out our Risk Retina offering.
TVaR is just one aspect of everything explored in the IRIS series, so SiRAcon ’23 provided a welcome opportunity to examine it in a little more depth. The big questions we set out to address were:
- How stable is the signal from TVaR for reporting purposes?, and
- How should practitioners go about characterizing the risk of extreme losses?
“Great Scott!”
To investigate TVaR’s stability, we did what any self-respecting data scientists would do: hop in the DeLorean, rev up to 88 mph, and head all the way back… to 2010. Or at least, that’s what we imagined doing while calculating 95th percentile TVaR estimates based on inflation-adjusted loss data back to the year 2000, stepping forward at monthly increments, starting in 2010 and ending in 2020.
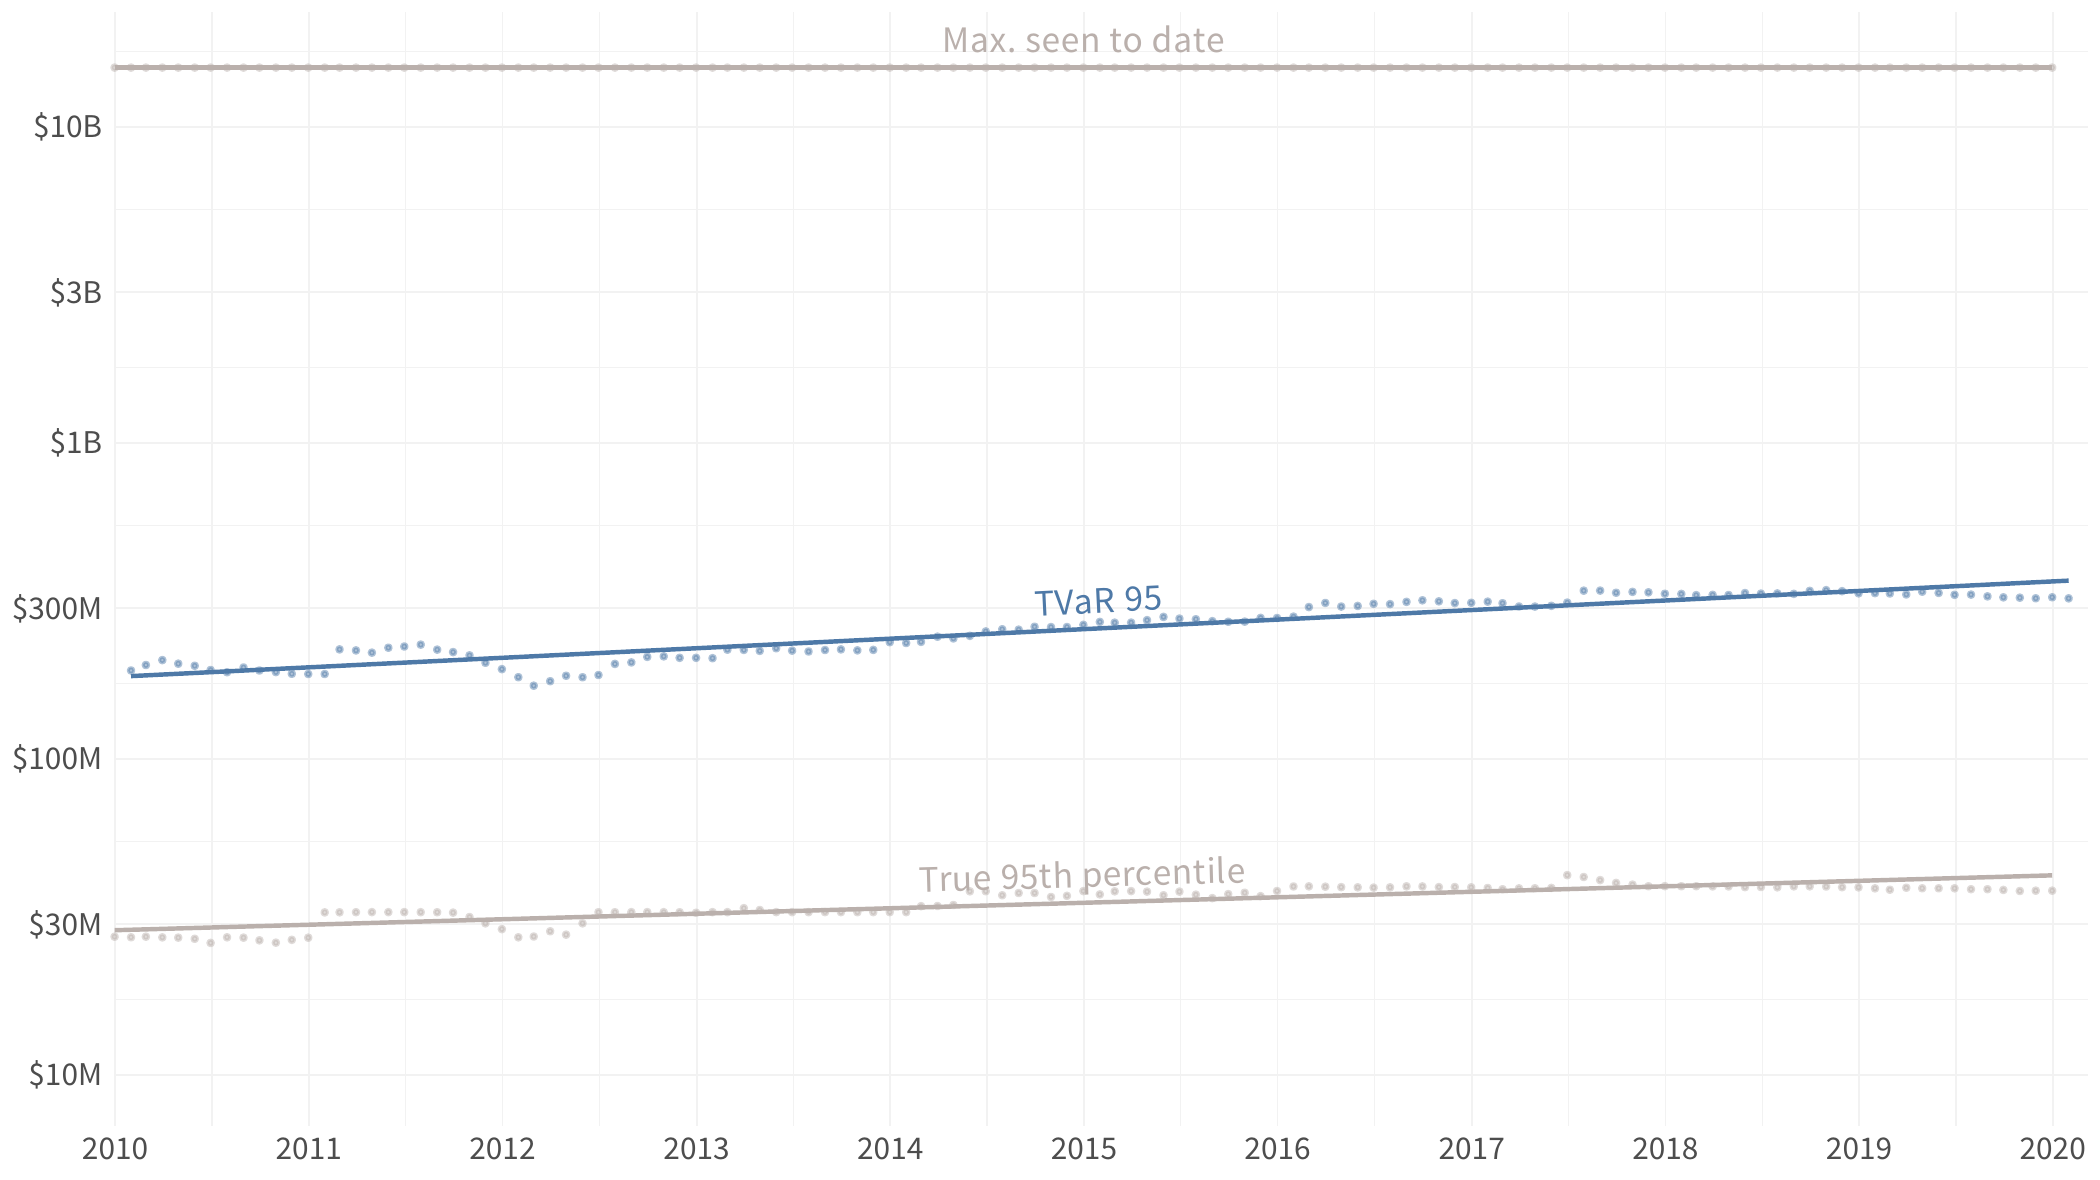
We’ve included the largest observed loss as well as the 95th percentile of the underlying data for reference. What hopefully stands out is the relatively flat nature of the monthly TVaR estimates while still reflecting… “flux”-uations in the real loss data.
Now when it comes to communicating extreme risk, the how is at least as important as the what, and there are some common, avoidable pitfalls one can address with a little bit of reframing.
- Establish context by anchoring to well-reasoned values for “typical” (e.g. median or geometric mean among peers).
- Use “1 in N” phrasing to moderate cognitive biases related to very small numbers (e.g. the likelihood of extreme losses or of your mother falling in love with you at the Enchantment Under the Sea dance).
- Use “N times …” phrasing to moderate cognitive biases related to very large numbers (e.g. magnitude of extreme losses in terms of annual revenue or 1.21 gigawatts in terms of annual household electricity usage).
- Manage your own expectations by recognizing that extremes can be difficult to reason about, especially when the stakes are high. For a variety of reasons, stakeholders will naturally gravitate toward treatment options of smaller, more tractable risk scenarios.
“Why don’t you make like a tree and get outta here?”
While not quite as valuable as actually visiting the future, TVaR and some communication tactics informed by behavioral economics can go a long way toward helping your organization manage the risk of extreme losses.