Back in early January (six months ago), I wrote a blog post about the rise of GitHub as a source for published vulnerability exploits. Since then, we’ve launched our Exploit Intelligence Service (EIS), where we aggregate not just GitHub exploits but references to other exploits as well. In this post, I am looking into how three major (and structured) sources for exploit code, GitHub, Exploit DB and Metasploit, have grown in 2021. Let’s jump right to the pretty plots.
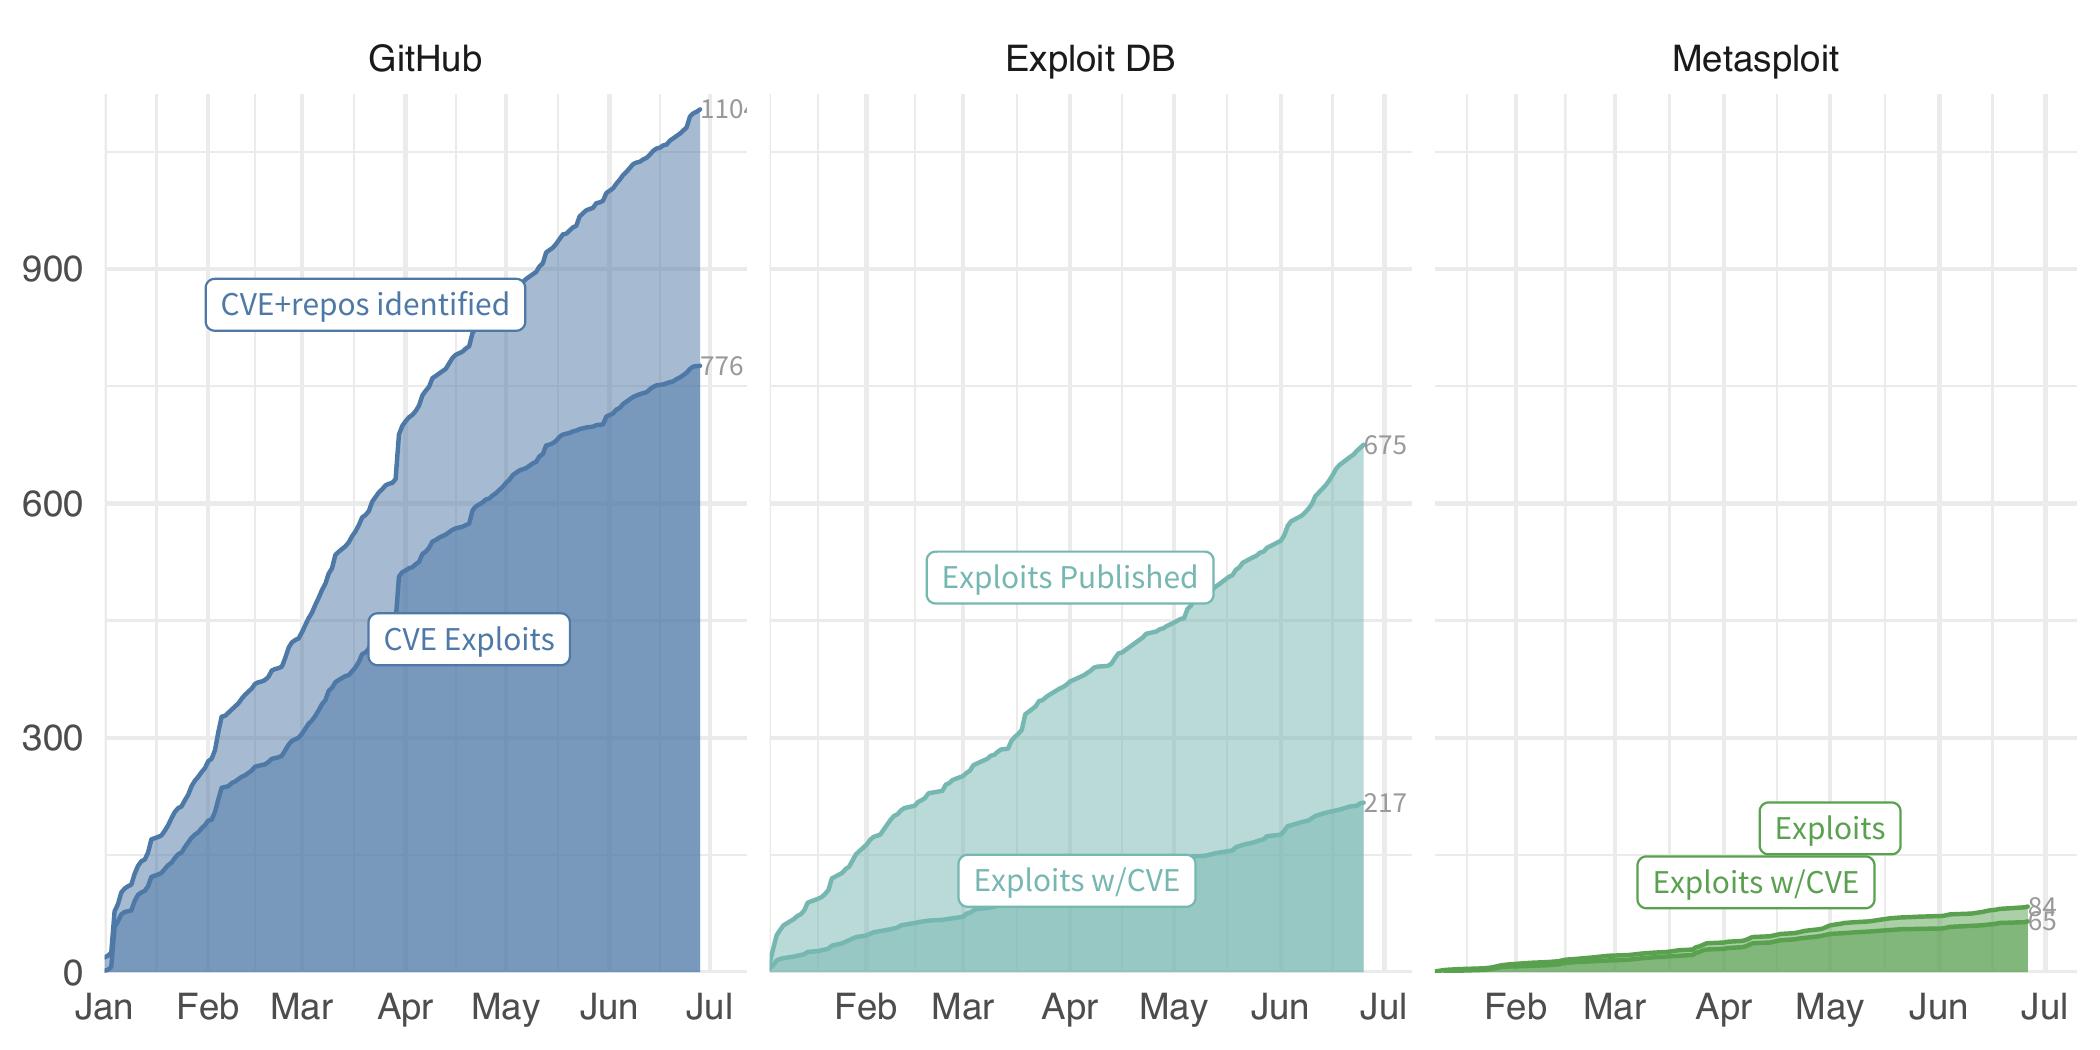
The difference here is pretty stark. We are estimating GitHub is averaging about 38 CVE exploits a week compared to 8 for Exploit DB, and almost 3 for Metasploit. Clearly GitHub is where all the cool hackers in hoodies are hanging out. But keep in mind, both Exploit DB and Metasploit only contain exploits, but not all of them have CVEs associated with the exploit and/or vulnerability. The above plot annotates whether there is an exploit with a CVE across all three as the solid shaded area from each source. GitHub on the other hand, contains code, some of which are exploits and we must do some inference to figure out which of the mentioned CVEs are associated with exploit code.
As I discussed in the previous post, we classify each repository as exploit code or not, using some fancy machine learning. Because the ML is extra fancy (technical term, don’t question it), we can set the threshold for how certain we need to be before we mark a repo as an exploit. Here, we set the threshold at 0.7 (on a scale of 0 to 1), so that anything the classifier says is above 0.7 we accept as an exploit.
One last complication is that each source may have more than one exploit for a CVE, and one exploit may claim to exploit more than one CVE. So let’s simplify this down and look at just the earliest exploit for each CVE. GitHub drops from 728 total to 495 unique CVEs. Clearly some duplication of effort on the exploits there. Exploit DB goes from 151 exploits to 157 CVEs. Some exploits must list multiple CVEs, and indeed, exploit DB ID 49795 (for example) lists 6 unique CVEs on a single exploit. Finally, Metasploit appears to be lean and mean with no obvious duplication, but behind the scenes there are a handful of duplicated CVEs and multi-CVE exploits. Just happens that they even each other out to produce the same count.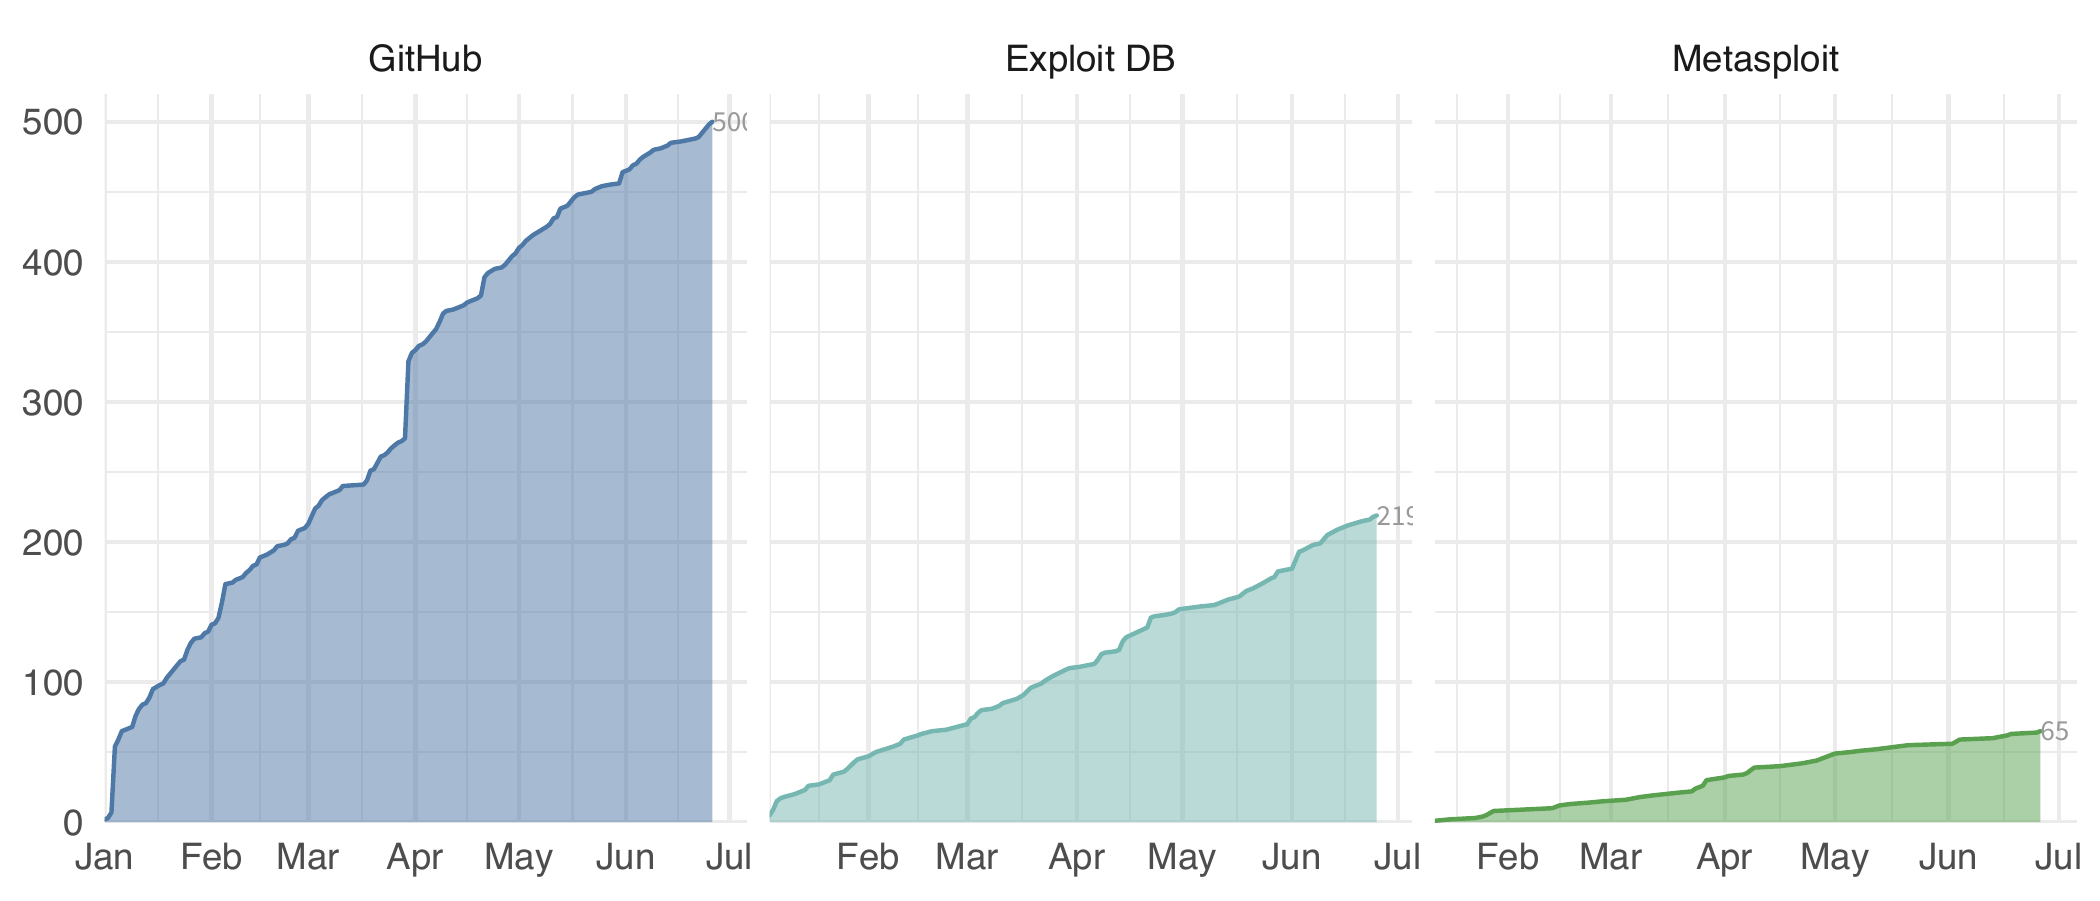
You may be asking yourself about the overlap between the three sources. If our goal here is to watch the threat landscape for published exploits (since we have evidence that a published exploit increases exploitation activity), then we’d want to know which CVEs we can identify from which sources. Maybe there is no overlap and each source has value, or maybe there is significant overlap…
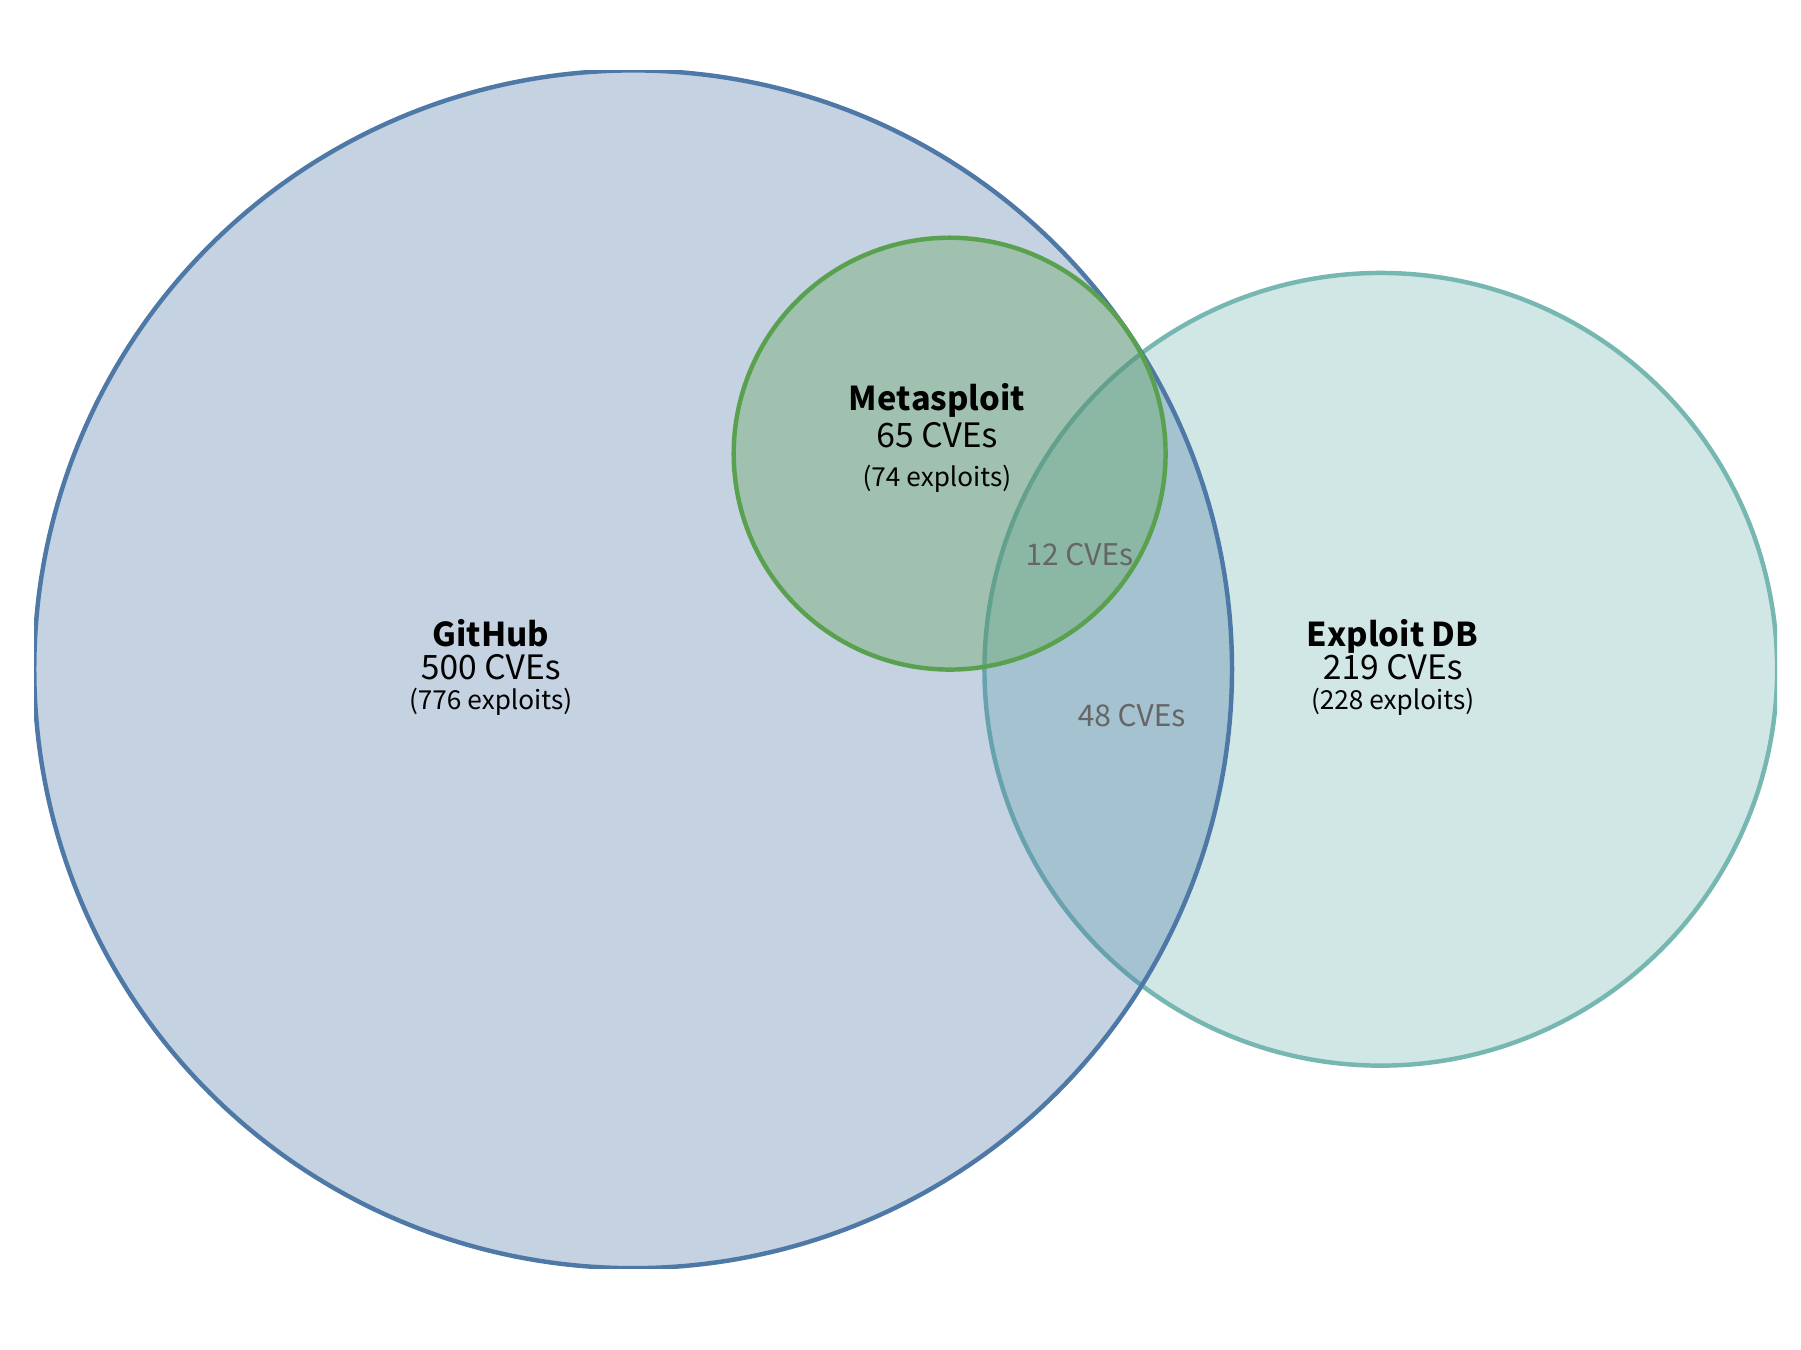
I know I’m showing my visual nerdery here (three body venn diagrams can get tricky to construct), but that’s a super interesting plot. First ALL of Metasploit CVEs are also found in GitHub repos. Not terribly surprising since Metasploit has a GitHub repo and authors will generally create their own repo for metasploit modules. But look at GitHub and Exploit DB, there is certainly some overlap, but the majority of the exploits are either in one or the other. Which means that both sources have value and are worthwhile to monitor and don’t have significant overlap.
Overall, it’s clear that GitHub is a source to keep an eye on. And I’d be remiss if I didn’t mention (shameless plug) that Cyentia has recently released a new Exploit Intelligence Service (EIS), which does just that!