
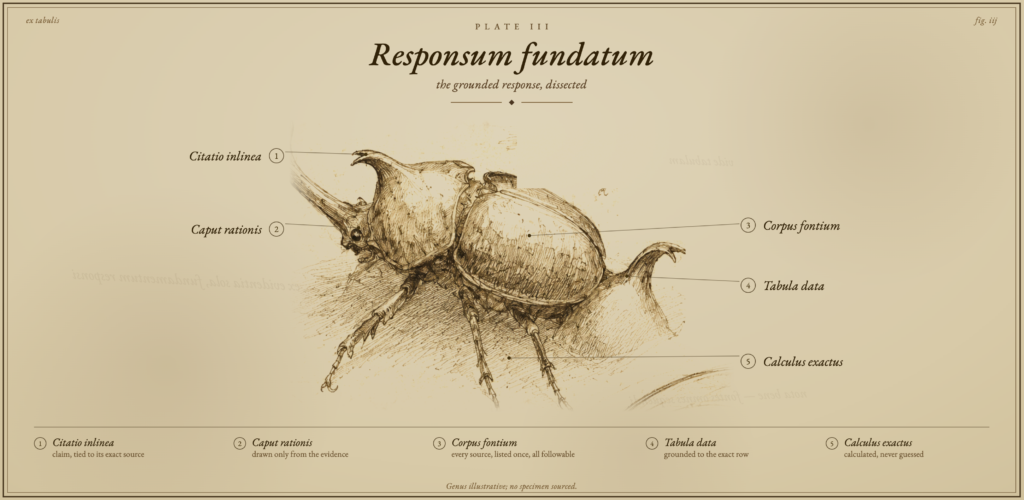
In case you’re joining mid-series: here’s the assistant announcement, Office Hours #1 on “I don’t know”-as-a-Service, and Office Hours #2 on what to do when a question doesn’t ground.
“Trust, but verify.”
The last two posts were about the assistant’s restraint: when it won’t answer, and what you do next. Now let’s explore when the assistant does answer, what is that answer made of?
“Grounded” is easy to say (and not too hard to fake), so let’s be concrete about what it means here. Every answer the assistant gives you carries its sourcing in two places: inline citations in the body of the response, and a source block underneath listing what those citations point to. The inline marks tell you which claim rests on which source; the source block tells you what that source actually is, so you can go read it yourself.
The second half is what does the work. A citation you can’t follow is just a footnote-shaped assertion, so it’s worth knowing what you land on when you follow one. After all, not all sources are the same kind of thing, and sometimes the kind matters. Let’s look at the different species of citations you are likely to encounter.
The two layers
Before the tour, the shape of a single response. Ask for the manufacturing sector’s overall ARO forecast, and the answer comes back with inline citations—each number tagged with where it came from, and a chart rendered right underneath in the source block:
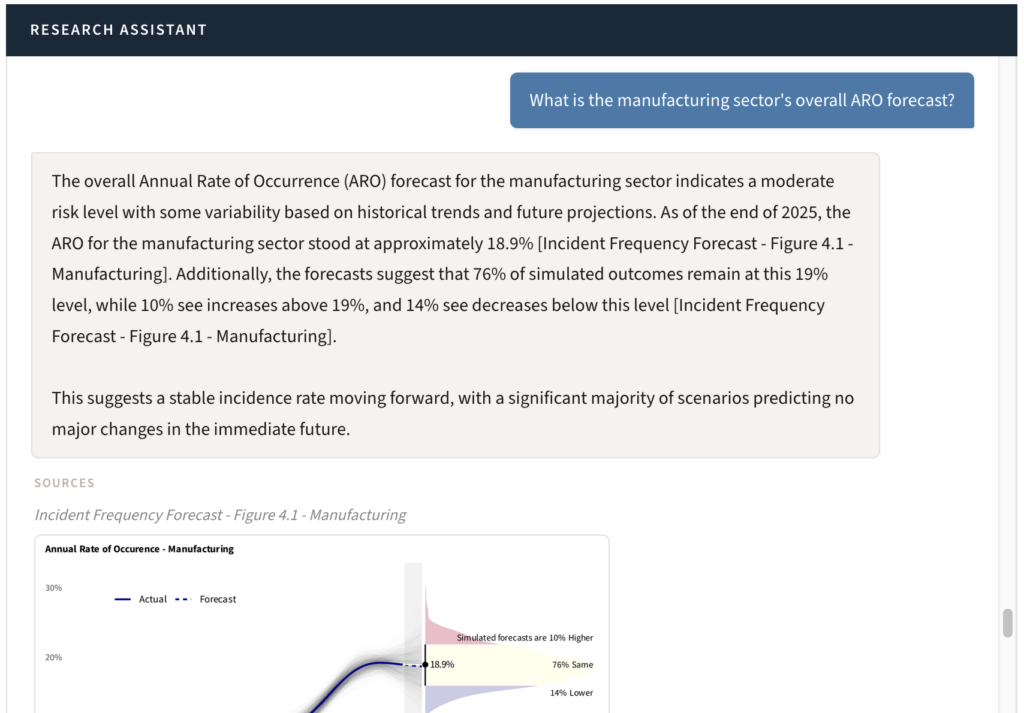
The inline marker is a claim-level link: this number came from this place. Here, [Incident Frequency Forecast - Figure 4.1 - Manufacturing] sits next to the 18.9% it supports, and the source block below shows the figure it points to. The source block itself is your index—every source the answer drew on, gathered once, so you can take in the whole evidentiary footprint at a glance and click through to any of it. Let’s take a closer look at what you’ll see when you do…
A citation to a chart
Sometimes the chart is the request. Ask for a specific figure and the assistant pulls it—rendered inline, hi-res, along with a description of it.
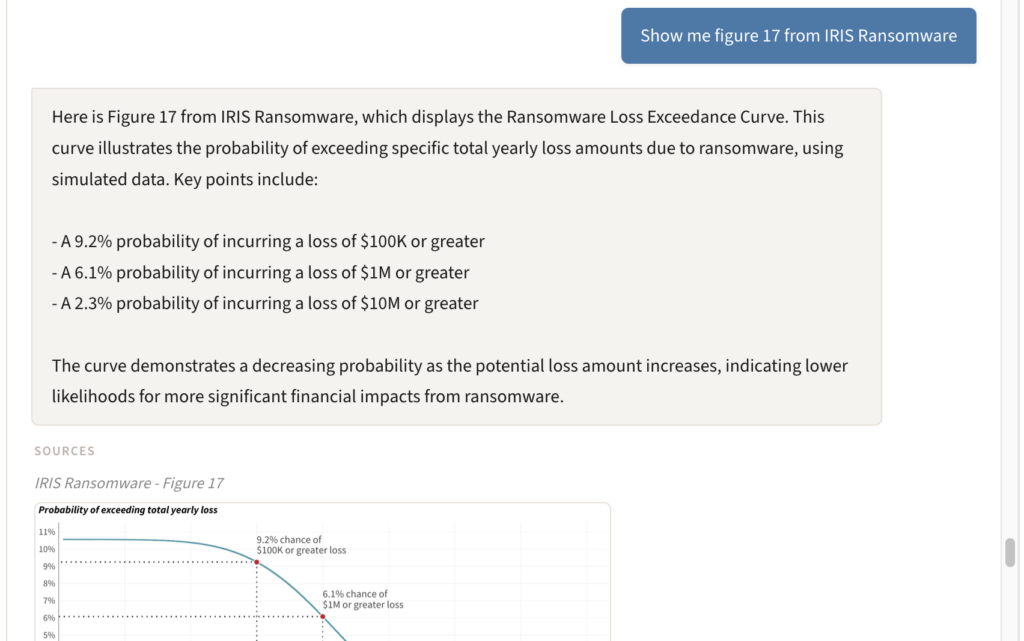
Ask to see Figure 17 from the ransomware report and you get the loss exceedance curve itself, annotations and all, with the answer reading the points off it: a 9.2% chance of a $100K-plus loss, 6.1% past $1M, and down from there. There’s no translation step to distrust—you’re looking at the source, not a summary of it. If your eye and the assistant’s read disagree, the chart wins.
A citation to a report
This ends up being the real workhorse. Most answers trace back to a specific IRIS or Retina report, and the citation resolves to which one, down to the page.

Asked for the annual probability of a cyber incident at a large information-sector firm, the assistant doesn’t say our research puts it at 17.9%—it says [2026 Annual Risk Baseline - Information, p.2], and the source block lists every report it consulted as a clickable link with a page number: IRIS 2025 p.12, IRIS 2022 p.3, the Baseline itself.
The page number is what separates a claim you can stand behind in a meeting from one you’re only repeating. “This report, page 2, says X” is auditable in a way “studies show X” never is. Pull the edition, find the section, check the assistant’s work.
A citation to a blog post

There are times when a blog post isn’t enough to justify a big decision, and the citation doesn’t pretend otherwise. Ask what effect record type has on losses and the answer cites [Marginal effect of record types on losses (2025-06)] (no page number since a blog post isn’t paginated like a report). The blog is often where we think out loud: argument and framing at least as often as primary measurement. A citation that lands here is flagging that distinction for you. This is commentary, not a figure from a study, so you can weight it accordingly.
A citation to a data table (CSV)
For paid Retina members, some sources aren’t prose at all—they’re data tables. A lookup query cites the exact row it pulled from.
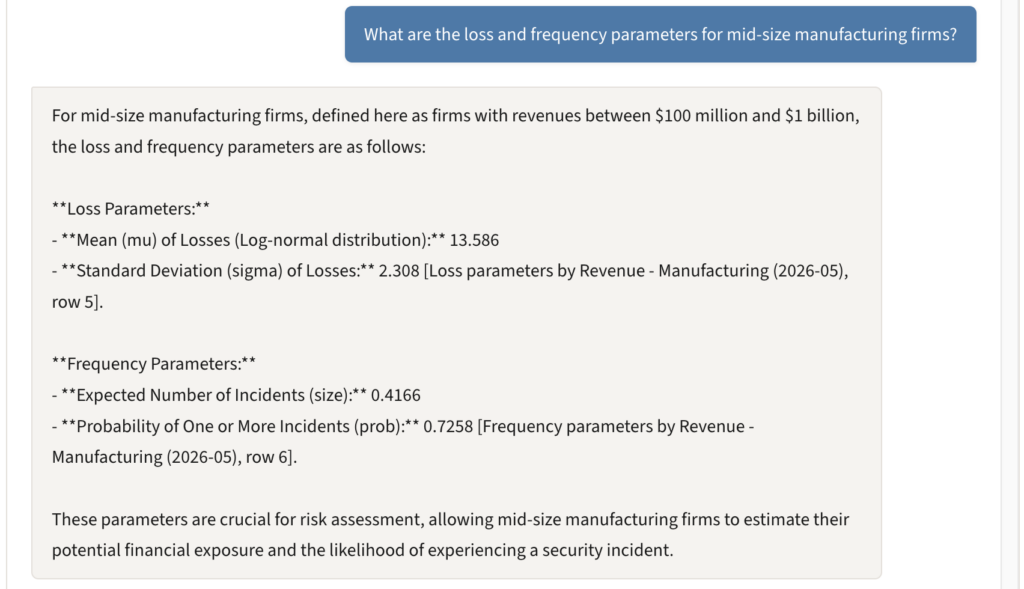
Ask for the loss and frequency parameters for mid-size manufacturing firms and you get the raw distribution parameters—mean, sigma, expected incidents—each tagged to its row: [Loss parameters by Revenue - Manufacturing (2026-05), row 5]. Nothing stands between you and the number. The answer is the data, and the citation points at the cell it came from.
A citation to an aggregation (SQL)
One that took a little elbow grease: ask an aggregation question—the three most frequent ATT&CK techniques, ordered by median loss—and the assistant doesn’t eyeball it from search results.
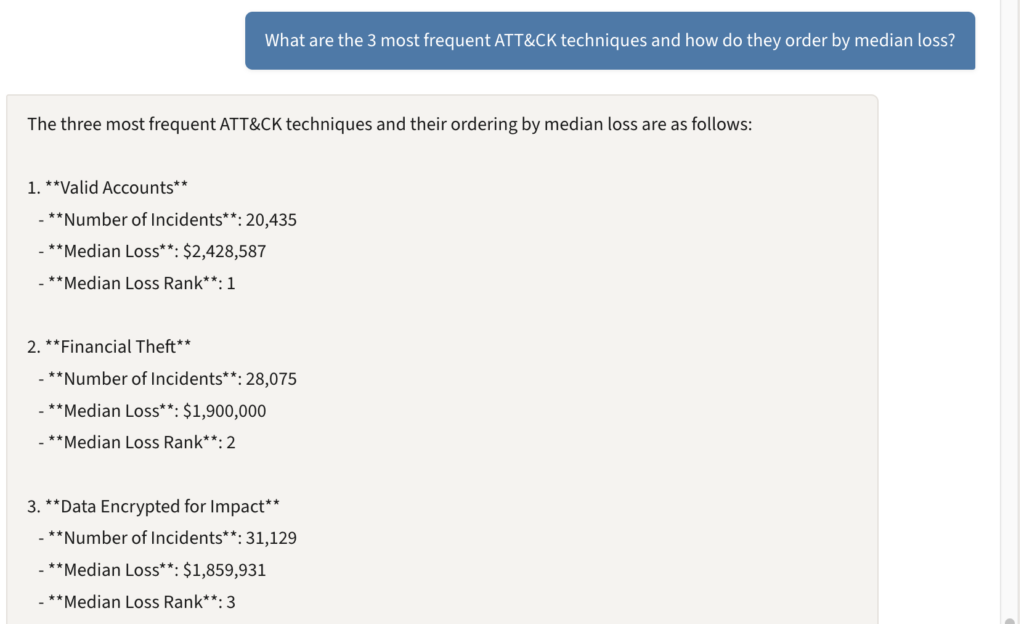
A structured query engine runs against the actual data, and the answer comes back computed rather than estimated. The citation says as much:

[Risk-based Prioritization of ATT&CK Techniques (structured query result)]. That parenthetical is the part to notice. A language model can answer “which technique causes the most losses” two ways: read a pile of text and guess at the total, or run the numbers. On screen the two are indistinguishable—one is a confident estimate, the other is arithmetic. A citation that reads structured query result instead of a page number is the system showing you which it did.
What the anatomy is for
When it comes to citations, we believe the whole is greater than the sum of its parts. A chart you read with your own eyes. A report you can audit to the page. A blog post that’s openly commentary. A data cell with nothing in front of it. A computed aggregate that was calculated, not guessed.
The restraint we spent two posts discussing is what keeps the assistant from answering past its evidence; the citations are how you confirm, claim by claim, whether it delivered. The first two posts asked you to trust the refusals. This one asks for less than that: don’t trust us, follow the links.