
You’ve labored for hours (days?) on a detailed cyber-risk assessment and you’ve just finished presenting it to your team. Someone immediately pipes up and says, “Ok, but what if….!”
It can be hard to pivot to hypothetical scenarios in these situations, particularly on the fly. Many of the more simplistic analysis approaches won’t easily accommodate these kinds of questions at all without starting over from scratch.
We recently received a question like this from one of our Risk Intelligence service subscribers, but luckily we were prepared! Specifically, our client wanted to know what the impact might be on our incident likelihood estimates if a certain type of incident increased dramatically in frequency. This particular request happened to be in the context of potential risk landscape changes related to AI developments (e.g. Mythos), but the same principles apply to a wide range of “what if” questions.
Thankfully, we’ve built a modeling pipeline that fairly seamlessly accommodates a straightforward & effective approach to tackling these kinds of alternate scenario questions. If we can identify some attributes of the sorts of incidents we think might increase (or decrease), we can flag those records in our data set and resample them to mimic a change in their frequency in the underlying data.
As an illustration, suppose we think incidents associated with the MITRE technique T1190 (Exploit Public Facing Application) are set to dramatically increase in the near future. Then we can resample incidents with that attribute in our data such that they appear 1.5x, 2x, etc as often, re-run the model and compare the results to measure the potential impact of that hypothesized change. The following table outlines an actual run-through of this exercise for two sectors and a particular revenue band within those sectors.
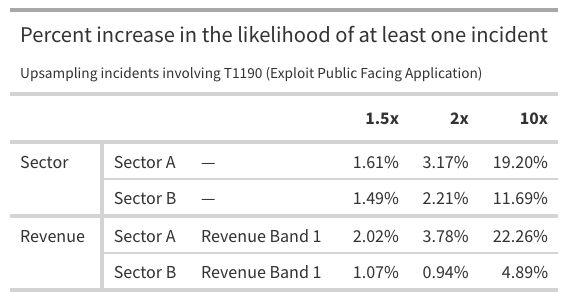
In this example, we ran through the “what if” scenarios of a dramatic increase in incidents involving the technique T1190. Specifically, we chose to investigate increases of 1.5x, 2x and 10x. So as an example, if there were 1,000 T1190-related incidents in the original data, we re-ran the model with those records resampled with replacement to constitute 1,500 records, 2,000 records or 10,000 records respectively.
The values in the body of the table represent the percent increase in the resulting estimated likelihoods of an incident in the subsequent 12mo period. i.e. 3.17% for Sector A under the 2x scenario means that an assumption of doubling T1190 incidents increased the estimated likelihood by 3.17%. (Not by 3.17 percentage points; we’re talking about multiplying by 1.0317, not adding 3.17 to the original likelihood.)
There are some important things that stand out to us about this exercise:
- First, that we can do this at all! Our modeling approach gives us a relatively convenient entry point to tackling these sorts of questions (dependent on how easily we can identify characteristics of incidents we’re interested in upsampling or downsampling, of course).
- Second, the results of extreme hypotheticals can be surprisingly modest. In this case, a dramatic 10x increase hypothetical led to at most a 22% increase in incident likelihood. That’s not nothing, but to make that concrete, it’s the equivalent of a 15% chance of an incident increasing to 18.3%. An increase, to be sure, but fairly modest.
- Lastly, embedding these investigations in an existing, sophisticated model means that we’re avoiding potential mistakes from making crude, simplistic assumptions. If you study the values in the table above, you may start to notice that the 10x increases are not simply 5 times the 2x estimates! 22.26% is considerably more than 5 x 3.78%, and that relationship is slightly different in each row! The resampling approach allows the estimates to follow the nonlinear nooks & crannies of the full, complex model.
If having access to these kinds of insights sounds appealing drop us a line!