 In case you missed it, Kenna Security recently released the latest report in our ongoing joint effort to measure and improve vulnerability management (VM). Prioritization to Prediction, Volume 5: In Search of Assets at Risk examines the vulnerability landscape through the lens of common asset platforms. I’ll briefly share two charts from the report along with a few takeaways that will (hopefully) help convince you that P2P V5 deserves to be on your reading list.
Remediation Velocity: Measures the speed and progress of remediation. How quickly are issues addressed and how long do they persist within and/or across assets?
The first chart we’ll look at compares remediation velocity across four major categories of assets. I think it’s helpful to think of remediation as a race. Some are quick off the starting line, closing large numbers of vulnerabilities in a short timeframe. Windows assets look to run in that way. Some hit their stride a little later and make up for lost ground in the long run. Macs fit that description, passing Windows-based assets just before the seven-month mark and hanging on to the lead for the duration. Others (*nix and appliances) never seem to kick remediation into a higher gear and run the remediation race at their own steady pace.
Figure 1: Comparison of remediation velocity across major asset categories
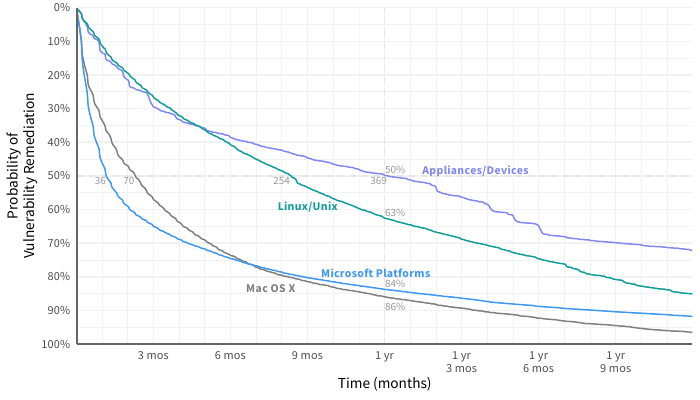
We’ve added some values to Figure 15 to highlight these differences. The half-life of vulnerabilities in a Windows system is 36 days. For network appliances, that jumps tenfold to 369 days! After one year, only about 15% of bugs remain on Mac and Windows assets, but Linux/Unix systems and network appliances still have a lot of work ahead of them.
If you’re looking for data to show upper management that squeezing a little more life out of those legacy Windows servers and desktops is a bad idea, this should do the trick.
Figure 2 splits out the Windows curve from Figure 1 among different Windows platforms. The difference in remediation velocity between the fastest version (Windows 10; 2016 Server) and the slowest (Windows XP) is pretty incredible. Let’s start at the top, where (indicated with a dotted lines) you’ll find older versions of Windows that are no longer supported. Clearly, that milestone in a platform’s life makes it much more difficult to manage vulnerabilities in a timely manner (or even at all). If you’re looking for data to show upper management that squeezing a little more life out of those legacy Windows servers and desktops is a bad idea, this should do the trick.
Figure 2: Comparison of remediation velocity across Windows platforms
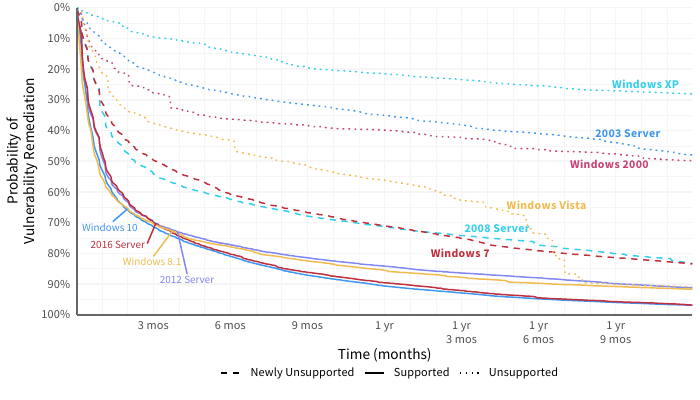
2008 Server and Windows 7 run in the middle of the pack in Figure 2. Mainstream support ended for both of these years ago, but extended support was available until January 2020. Since we pulled data for this report at the beginning of 2020, extended support was available for the duration of the timeline shown in the chart.
The latest desktop and server versions all cluster tightly together at the bottom in Figure 2. I interpret this as strong evidence that Microsoft (and the ecosystem of third-party tools for Microsoft products) is making it increasingly more efficient for organizations to manage vulnerabilities affecting supported versions of their operating systems. The recipe of a regular cadence for patch releases, automatic/forced updates (love them or loathe them), efficient tools for deploying patches, etc., appears to be yielding good fruit for fast fixes.
I interpret this as strong evidence that Microsoft is making it increasingly more efficient for organizations to manage vulnerabilities affecting supported versions of their operating systems.
I have one more observation before closing out this post. There’s less difference between Windows desktops and servers than I anticipated. This may tie back to the reliable and streamlined cadence of patch release and remediation easing classic concerns like patch deployments blue-screening critical servers over time.
If you’d like to see platform-based comparisons like those above for a wider variety of metrics, download the full report. In addition to remediation velocity, we examine:
- Vulnerability Density: Median number of vulnerabilities detected on assets
- Assets at Risk: Percentage of assets with at least one open high-risk vulnerability
- High-Risk Density: Median number of high-risk vulnerabilities detected on assets
- High-Risk Coverage: Percentage of all high-risk vulnerabilities remediated
- Fix Rate: Median percentage of total vulnerabilities closed in a given month
- Net Capacity: Percentage of assets where high-risk vulnerability closures meet/exceed new vulns
Thanks for reading!