“I am large, I contain multitudes.” Walt Whitman
This post will be a bit of a deep dive into some of the technical considerations that go into analyses that we provide to our Risk Retina subscribers. Fair warning, things might get at least mildly statistical!
We’ll start with a standard question that we have addressed in much of our research: what’s the likelihood of my firm experiencing at least one cyber incident in the next 12 months?
Let’s call this quantity the Annual Rate of Occurrence (ARO), just for brevity’s sake.
To be more precise, suppose we’re asking this question in January 2026 and we posses cyber incident data that runs through the end of 2025. How do we think about how to answer this question?
First, what can we calculate directly from the data we have? An approach that has served us well in much of our research has been to:
- take prior 1yr sliding windows of incidents
- compute counts of incidents over these periods
- use them to estimate a distribution about which we can make probability statements
For example, we have often taken all the 1yr periods in the past 5 years and used them to generate a probability distribution that represents what has happened, “on average”, in the relatively recent past. If we do this at monthly intervals, it yields 49 1yr periods across 5 years. Let’s call this a backward looking approach.
Any methodology has at least some drawbacks, and this one is no different. One might object that the cybersecurity landscape has been shifting rapidly over the past five years, and treating data from 5 years ago on the same footing as data from only 1 year ago may be misleading. The potency of this objection will vary, naturally, depending on how quickly you believe the ground is shifting under us for a particular industry or size of firm. For some groups, the risk may have remained quite stable, for others, perhaps not so much.
It was partially with this in mind that we began more explicitly accounting for time, as in our recent IRIS 2025 report. For example, we began including an explicit time component in our models for estimating a probability distribution. That leads to pretty graphs like this (not actually from IRIS 2025, but in this vein):
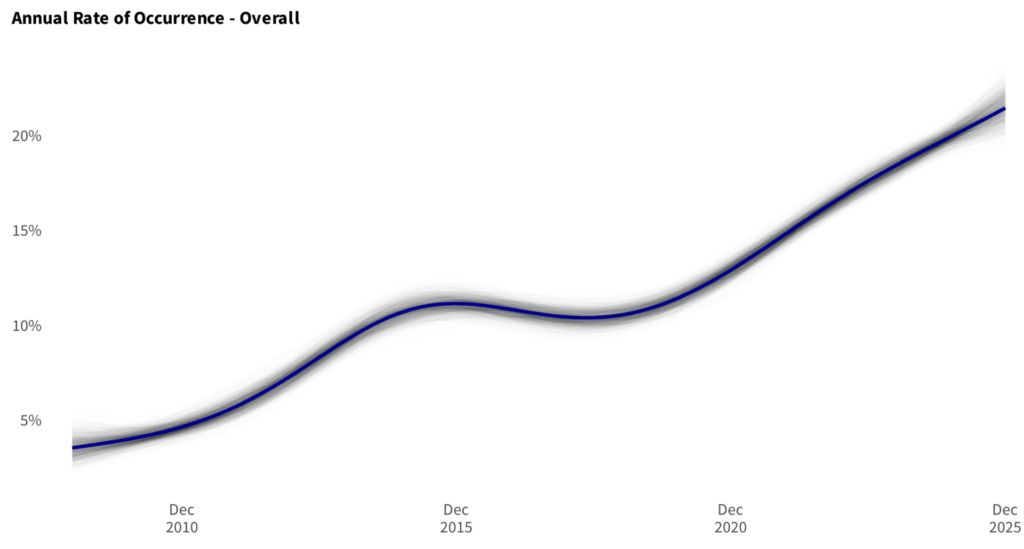
This gives us a view into how ARO has changed over time, as well as which periods in time may have involved more or less volatility.
(Note that these graphs are all somewhat hypothetical as this analysis is ongoing, so aspects of it may change.)
With this in hand, we might move from our “backward looking” estimate over the previous 5 years to something more current. For example, we might instead simply take the most recent (rightmost) probability estimate from this curve, as that is likely to be more “current” and reflect what’s happening “now”. Because this estimate arguably does a better job of balancing the relative importance of recent data, we’ll call this a balanced approach. Of course, there are always trade-offs! In this case, the boundary of a time series curve is often difficult to estimate in a stable fashion, so in a sense we’ve made our estimate better reflect “now” in exchange for some increased uncertainty or variance.
You should note that we just put “now” in quotes in the previous paragraph, because here’s where things start to get tricky. Recall that we’re asking this question in January of 2026 but the “rightmost” point on this chart is December 2025! Why are we so stuck in the past? (Boomer! 😉)
A little thought should reveal that this is a direct consequence of how we’ve structured our question. Because with ARO we’re explicitly talking about the likelihood over the next 12mo, we need a full year’s worth of data as a sort of “runway” to calculate anything directly. The most recent complete one year period in our hypothetical data runs from January 2025 to December 2025. We can’t calculate anything directly from our data that reaches off the end of that cliff, lest we end up like Wile E. Coyote.
Of course, the obvious rejoinder is that surely we could forecast or project an answer? Yes! As long as we are once again comfortable with the trade-offs, namely more recency in exchange for more variance. Once we start projecting beyond the bounds of our data, it is vitally important that we remain aware of the uncertainties involved. To see what that looks like, consider the following extension of the previous graph:
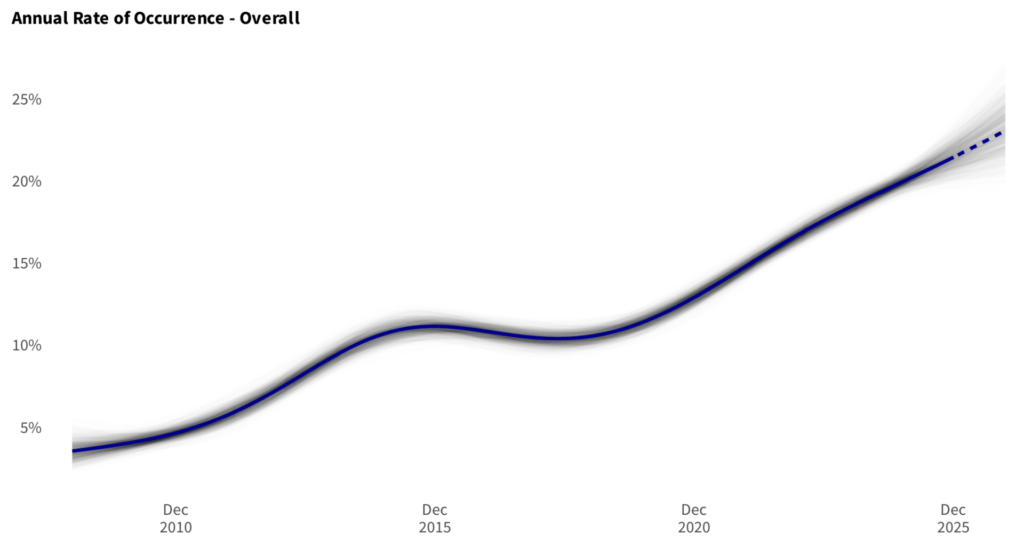
The dotted line represents values extrapolated into the future. Now the chart ends in December 2026, so we could take the estimates from the rightmost slice and finally have an estimate that is fully up-to-date. Because this estimate involves an explicit forecast beyond the range of our data, we’ll call this a forward looking approach. However, it should be clear from the way the curves splay out in different directions that we have once again traded recency for uncertainty! Given the fairly low level of uncertainty indicated here, we consider that a good trade. But our aim is to support risk decisions, not make them. You do you.
Why go to all this trouble to describe three different ways of doing the same thing? Why can’t you blasted statisticians just give us a single answer, dagnabbit?! We get it, but we have our reasons. Like Walt Whitman, the world of cybersecurity is large and contains multitudes. Which estimate is preferably may be different for different organizations and different scenarios. For example,
- Backward looking – Your interest is in a stable, low variance estimate of risk in the relatively recent past (i.e. “How likely has it been for a typical firm to experience a cyber loss in the 2020s? And how does that compare to my firm’s experience over that time?”)
- Balanced – Your interest is in an estimate of risk that is more current and you’re willing to except some variance in that estimate (i.e. “About how likely is my firm to experience a cyber loss right now?”)
- Forward looking – Your interest is in the most current, forward looking estimate and you’re willing to accept a decent amount of uncertainty in exchange (i.e. “About how likely will it be for my firm to experience a cyber loss next year? And how might that influence a given project or control proposal?”)
These sorts of analyses also open up the possibility for us to make statements about the future and then revisit them to see if we were right or wrong! 😱 We realize that’s fairly unheard of in the cybersecurity analysis world, but we’re just sadistic enough to enjoy it ourselves (sort of).
If this kind of stuff gets you thinking and piques your interest, consider reaching out to discuss options for getting even more like this!